The Samsung 960 EVO (1TB) Review
by Billy Tallis on November 15, 2016 10:00 AM ESTPerformance Consistency
Our performance consistency test explores the extent to which a drive can reliably sustain performance during a long-duration random write test. Specifications for consumer drives typically list peak performance numbers only attainable in ideal conditions. The performance in a worst-case scenario can be drastically different as over the course of a long test drives can run out of spare area, have to start performing garbage collection, and sometimes even reach power or thermal limits.
In addition to an overall decline in performance, a long test can show patterns in how performance varies on shorter timescales. Some drives will exhibit very little variance in performance from second to second, while others will show massive drops in performance during each garbage collection cycle but otherwise maintain good performance, and others show constantly wide variance. If a drive periodically slows to hard drive levels of performance, it may feel slow to use even if its overall average performance is very high.
To maximally stress the drive's controller and force it to perform garbage collection and wear leveling, this test conducts 4kB random writes with a queue depth of 32. The drive is filled before the start of the test, and the test duration is one hour. Any spare area will be exhausted early in the test and by the end of the hour even the largest drives with the most overprovisioning will have reached a steady state. We use the last 400 seconds of the test to score the drive both on steady-state average writes per second and on its performance divided by the standard deviation.
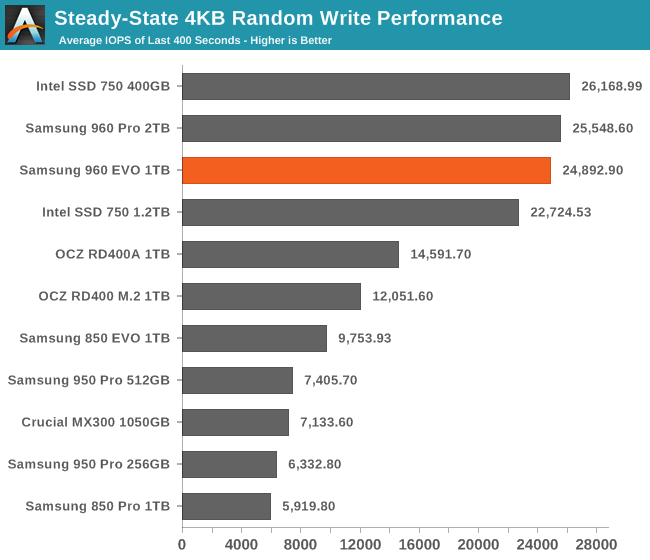
The 960 EVO's steady state random write speed is not quite as fast as the 960 Pro, but it's in the same league and much faster than most consumer SSDs.
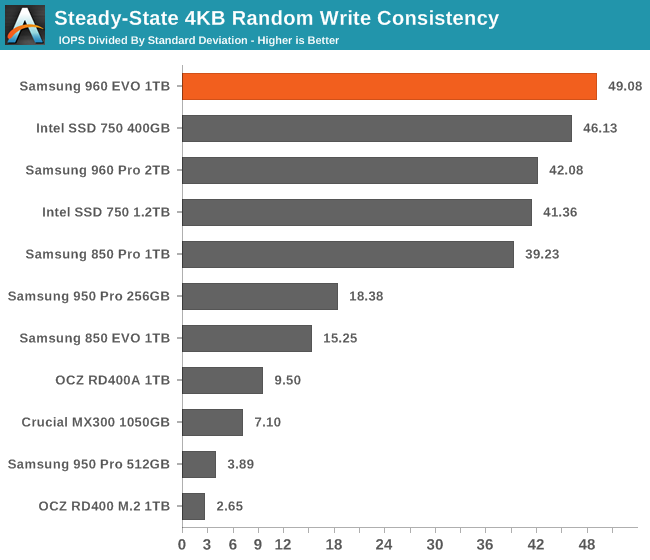
The 960 EVO sets a new record for combining high performance with consistency. It's a bit slower than the 960 Pro, but less variable.
 |
|||||||||
| Default | |||||||||
| 25% Over-Provisioning | |||||||||
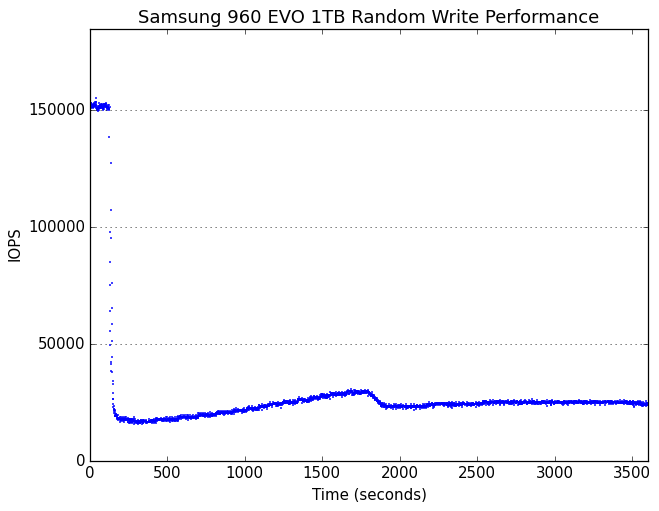
Highly consistent performance is a good thing, but it makes for a boring graph. The transitions from peak to sustained performance modes look the same for both the 960 Pro and the 960 EVO.
 |
|||||||||
| Default | |||||||||
| 25% Over-Provisioning | |||||||||
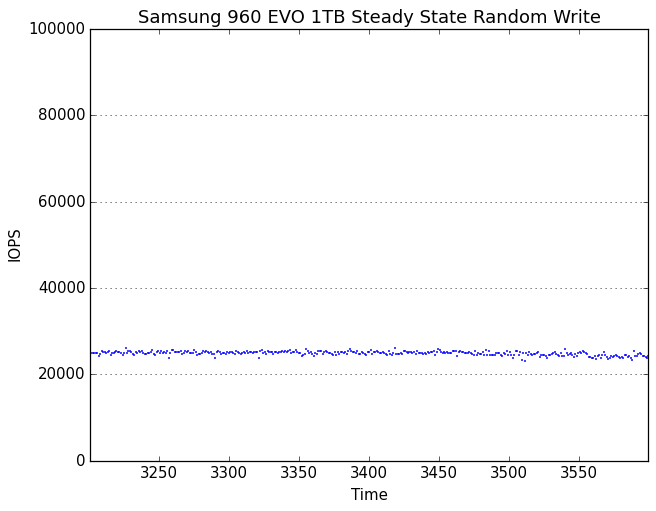
The 960 EVO responds to extra overprovisioning with even more consistent (and high) performance.


87 Comments
View All Comments
Lolimaster - Wednesday, November 16, 2016 - link
The pci.e speed only matters if you move with huge chunks of data such as a high res video editing. For pretty much anything else it offers nothing over sata ssd's.Flying Aardvark - Wednesday, November 16, 2016 - link
"The pci.e speed only matters if you move with huge chunks of data such as a high res video editing. For pretty much anything else it offers nothing over sata ssd's."In which case, you'd want something that won't throttle under heavy load like the Intel 750. Otherwise, the 600P makes more sense in M.2 form (if it remains cheaper than the 960 EVO).
MajGenRelativity - Tuesday, November 15, 2016 - link
While I agree that both SSD's are fantastic performers (I bought a 500GB 850 Evo), I don't think that your statement on buying other products is right. Some users cannot afford either, and a cheaper SSD would provide a nice uplift.Samus - Wednesday, November 16, 2016 - link
The 860 EVO is selling around 20% more than the 850 EVO did at launch. Just because its NVMe doesn't mean Samsung can milk that much more out of it, the Intel 600p is NVMe and it cost almost half the price. And...Intel. I get that Samsung has improved tremendously in SSD reliability but many of us still have a sour butthole from the 840 TLC drives they never really fixed and honestly, we're comparing Porsches to Ferraris here. Nobody is going to notice the difference between these drives is day-to-day tasks.close - Wednesday, November 16, 2016 - link
"And...Intel"Can't say I really agree with this "default" view since I happened to see the end-of-life behavior for some Intel SSD's. This was some years ago (4-5) so the experience might not be relevant now but for multiple SSDs when they got close to their end of life I just got a warning popup in Windows to back up my data. That's it. I foolishly made the assumption that I can just image the SSD to speed up the process only to realize after the reboot that the SSD controller just killed itself on shutdown.
This isn't the kind of behavior you expect from any data storage medium. The explanation was that Intel was trying to avoid data loss from the drive just failing due to wear. And they chose to mitigate this by triggering data loss by design choice.
While the price and performance may be good I still have to think twice (or more) when considering Intel SSDs.
Phattio - Wednesday, November 16, 2016 - link
@close: thank you for posting this. good to know!Samus - Thursday, November 17, 2016 - link
Wow interesting I've come across dozens of X25-M's and lowest health I've seen was 77% in Intel SSD Toolbox and that was a 300GB SSD320 in an exchange server. The MDB was over 100GBAscaris - Friday, December 16, 2016 - link
Have to agree; that's completely unacceptable behavior. Samsung's 840 Pro (I think it was) went way, way beyond its rated life in the TechReport test (over 1 petabyte) before finally giving up the ghost. If the Intel in question bricked itself based on published ratings, it could have cut its useful life in half. I don't know if that's how it did it... a better way (that it could feasibly have also used) would be to issue the warning when most or all of the overprovisioned spare cells have been deployed to replace those that have worn out (which ought to be a sure sign that all of the cells are close to the edge because of wear leveling)... but if anything, it should go read-only, not brick itself.DrunkenDonkey - Tuesday, November 15, 2016 - link
Billy Tallis, can you make a QD1 comparison graph alongside the mix of 1,2,4? Because average end user pretty much only cares for 4k QD1, RR, the mixed stat is more niche and not indicative. Thanks.Flying Aardvark - Wednesday, November 16, 2016 - link
Seconded. Reads like an ad otherwise.