The MyDigitalSSD SBX SSD Review: NVMe On The Cheap
by Billy Tallis on May 1, 2018 8:05 AM ESTMixed Random Performance
Our test of mixed random reads and writes covers mixes varying from pure reads to pure writes at 10% increments. Each mix is tested for up to 1 minute or 32GB of data transferred. The test is conducted with a queue depth of 4, and is limited to a 64GB span of the drive. In between each mix, the drive is given idle time of up to one minute so that the overall duty cycle is 50%.
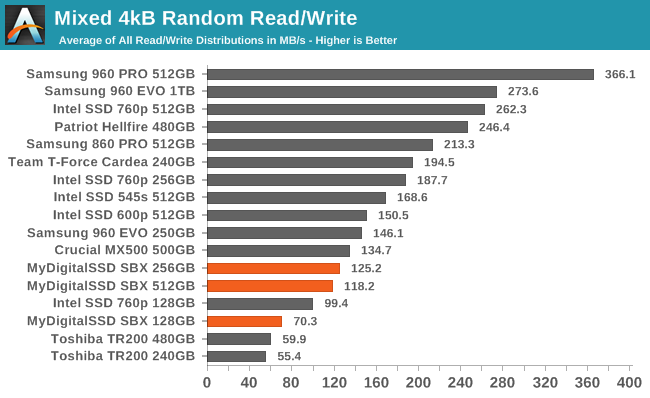
The mixed random I/O performance of the MyDigitalSSD SBX is worse than mainstream SATA drives and all of the NVMe competition. The 512GB SBX even manages to be a bit slower than the 256GB model.
 |
|||||||||
| Power Efficiency in MB/s/W | Average Power in W | ||||||||
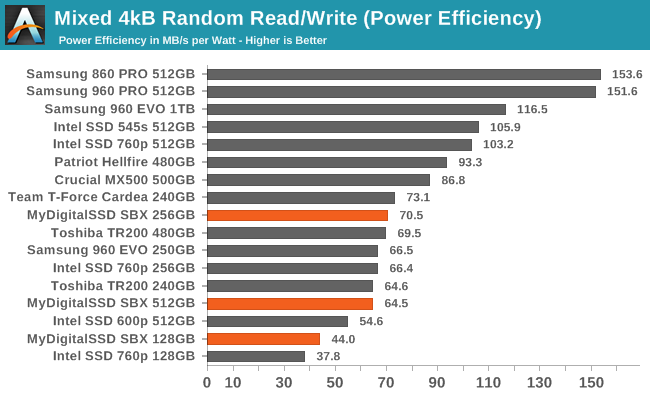
Despite poor performance, the larger two capacities of the SBX have reasonable power efficiency on the mixed random I/O test, and the smallest is at least more efficient than the Intel 760p. Looking at power consumption in absolute terms, there is a clear gap between all of the PCIe x4 drives using at least 2.2W and the SBX topping out at 1.8W.
 |
|||||||||
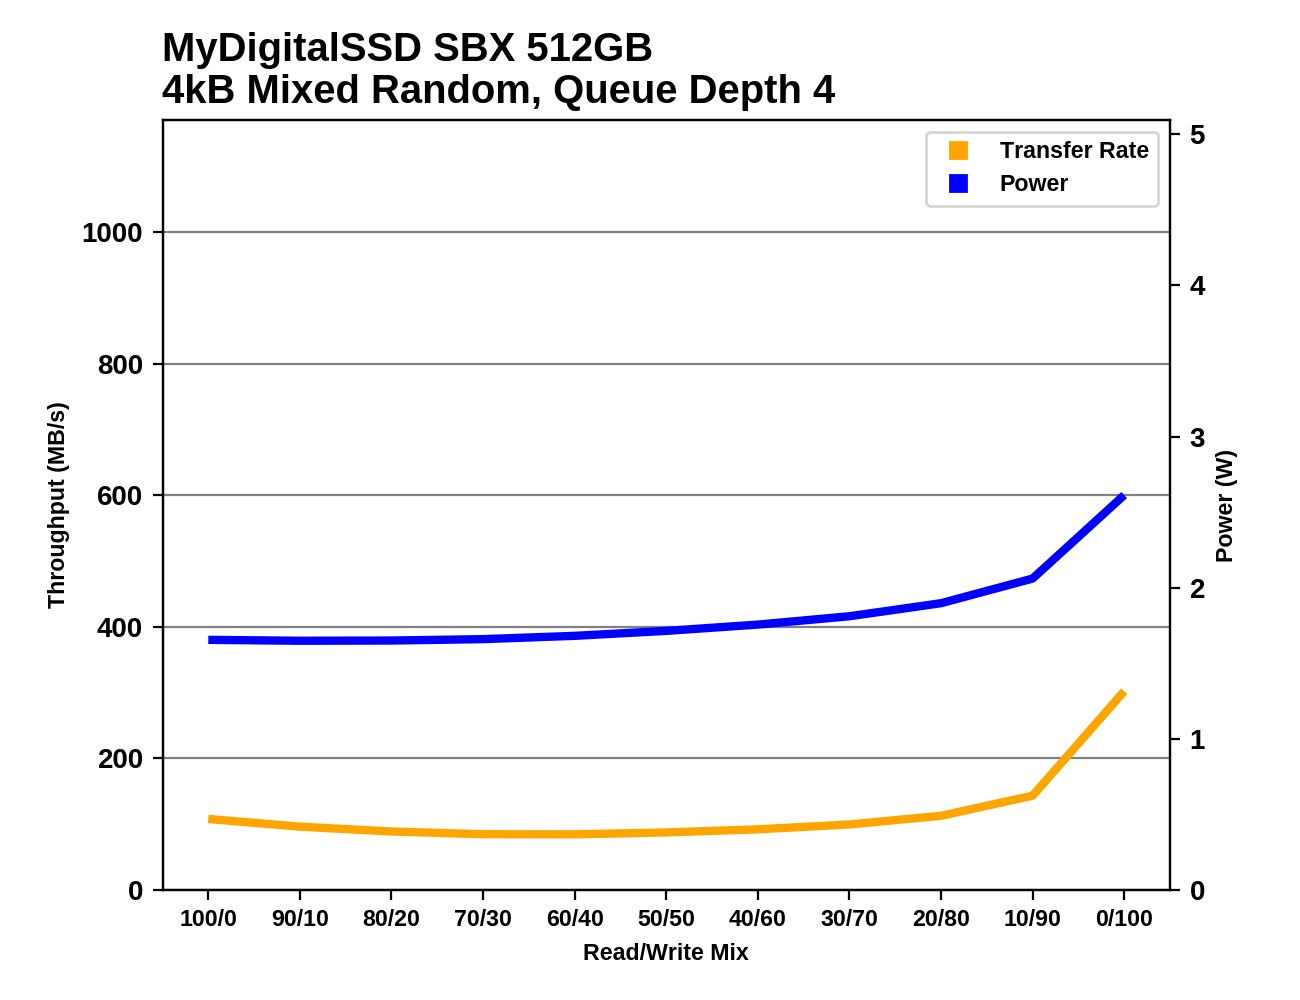
The shape of the performance curves for the SBX on the mixed random I/O test is typical: performance is low and mostly flat or slightly U-shaped for most of the test, then a clear increase in performance as the workload approaches pure random writes. That late boost in performance during the most write-heavy phases of the test is much smaller for the SBX than most high-end drives, and it isn't able to surpass the limits of SATA SSDs.
Mixed Sequential Performance
Our test of mixed sequential reads and writes differs from the mixed random I/O test by performing 128kB sequential accesses rather than 4kB accesses at random locations, and the sequential test is conducted at queue depth 1. The range of mixes tested is the same, and the timing and limits on data transfers are also the same as above.
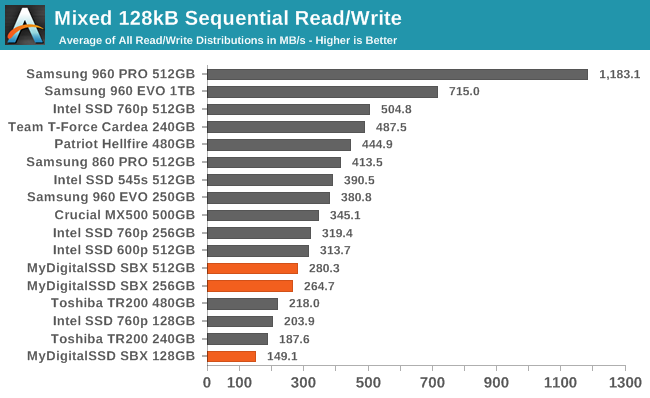
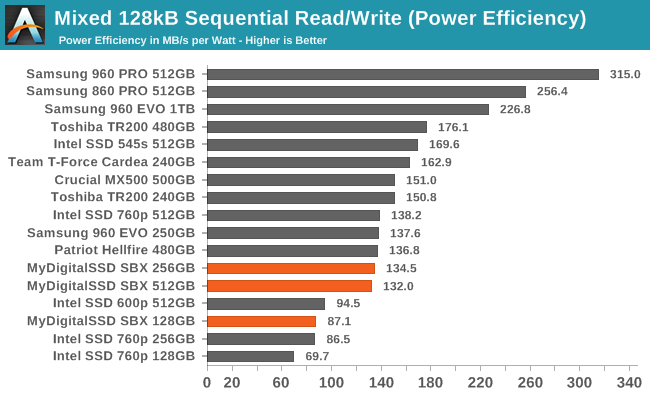
As with the mixed random I/O test, the performance results for the mixed sequential test put the MyDigitalSSD SBX below the current crop of mainstream SSDs and below all the other NVMe SSDs in this comparison—though the latter result is more or less expected. It's disappointing to see even the Intel 600p outperform the SBX.
 |
|||||||||
| Power Efficiency in MB/s/W | Average Power in W | ||||||||
The power efficiency from the MyDigitalSSD SBX is low, but only the 128GB model stands out as being well below average, and it is at least joined at the bottom of the charts by several Intel drives. As usual, the absolute power draw of the SBX is more typical for a SATA drive than a NVMe drive.
 |
|||||||||
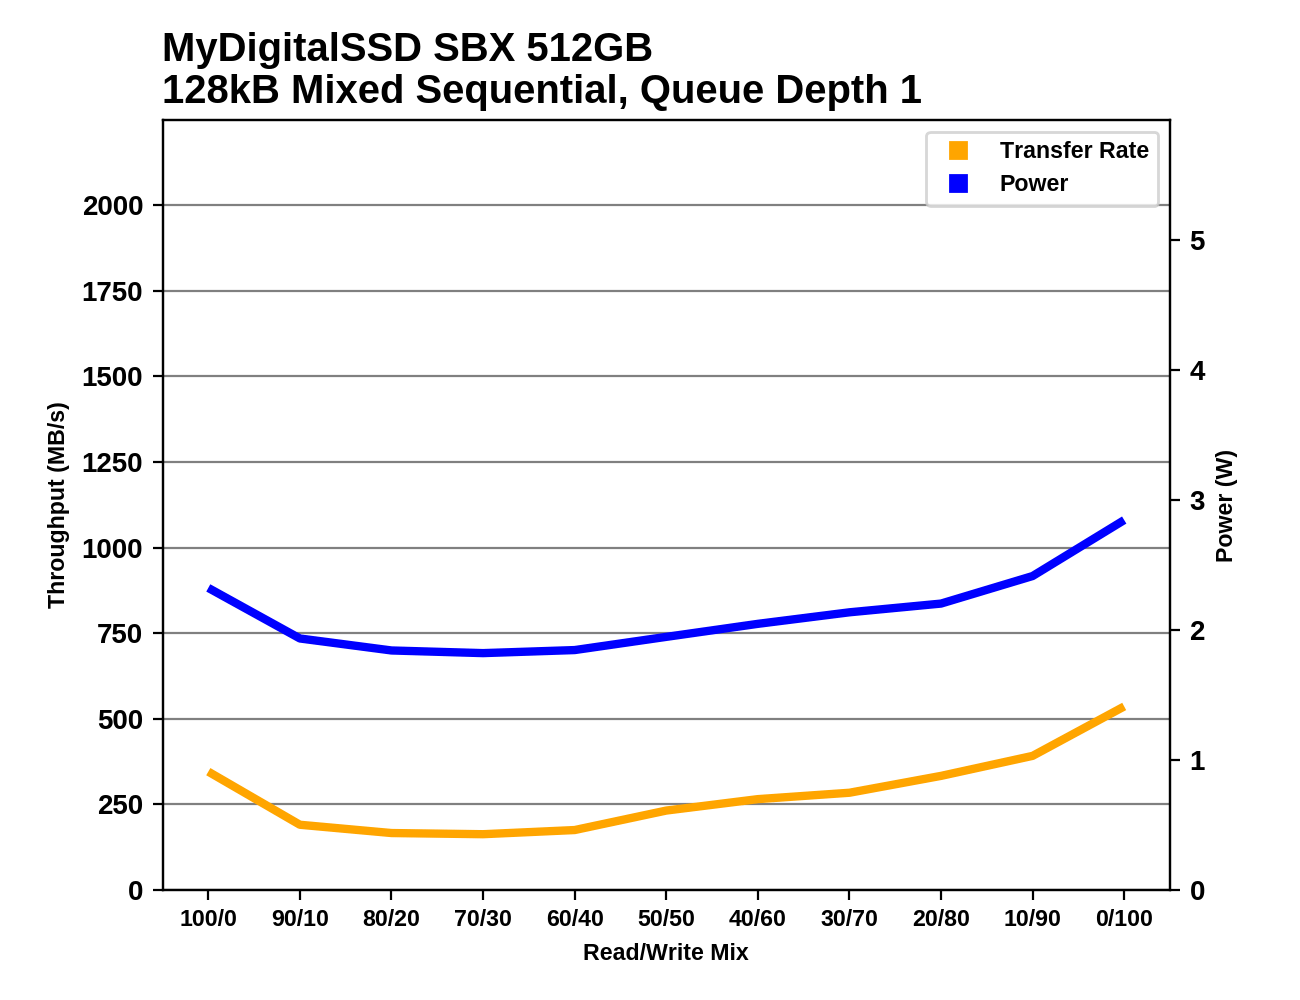
The performance of the MyDigitalSSD SBX drops during the early phases of the test, reaching a minimum with a relatively read-heavy workload before recovering slightly. In the second half of the test as the workload is more write-heavy, the 512GB SBX picks up speed but the 256GB and 128GB models stay at a roughly constant performance level. The 128GB then drops again in the final phase of the test with a pure write workload.


46 Comments
View All Comments
peevee - Friday, May 4, 2018 - link
What dgingeri said. Learn your stuff before commenting.Looks like it is a fraud on the part of manufacturer, or a fk-up on the AT side.
Billy Tallis - Friday, May 4, 2018 - link
Literally everything in your comment is wrong.MajGenRelativity - Tuesday, May 8, 2018 - link
I don't see in your link where it says that drives can switch between NVMe and AHCI.Lolimaster - Saturday, May 5, 2018 - link
The thing is that unless you need to work with huge data (editing for example) buying an NVME SSD makes ZERO sense specially on a laptop with the added powerconsumption and heat vs a sata ssd that will be as fast for all of the usages of a non-prosumer.Lolimaster - Saturday, May 5, 2018 - link
It's nice that you see those 1-2-3GB/s on crystaldiskmark but it's totally wasted for 99% of your daily usage.Lolimaster - Saturday, May 5, 2018 - link
Want faster boot having alreayd an SSD? Enable fast boot on bios to skip some checks.