The Apple iPhone 11, 11 Pro & 11 Pro Max Review: Performance, Battery, & Camera Elevated
by Andrei Frumusanu on October 16, 2019 8:30 AM ESTDisplay Measurement
When it comes to displays, last year's iPhone XS didn’t showcase any major display changes compared to the original iPhone X, as the two phones seemingly shared the same display panel. In contrast to that situation, for the new iPhone 11 Pros, Apple is advertising using a newer generation panel which brings notable improvements with it.
In terms of dimensions or resolution, there’s no visible changes on the new panels, and you’d have to look under the hood to see what has actually changed. The most notable improvement this year is a switch in the OLED emitter material that’s been used by Samsung in producing the new screen. The new generation emitter was first introduced in the display panel of the Galaxy S10, and to my knowledge it has subsequently only been used in the Note10 series as well as the new OnePlus 7T (regular version only). The iPhone 11 Pro phones now join this limited group of devices, and the biggest improvements to the user experience will be higher maximum brightness levels as well as improved power efficiency.
The regular iPhone 11, on the other hand does not seem to have changed much from the iPhone XR. It remains a relatively lower resolution LCD screen, although its display characteristics remain excellent.
We move on to the display calibration and fundamental display measurements of the iPhone 11 screens. As always, we thank X-Rite and SpecraCal, as our measurements are performed with an X-Rite i1Pro 2 spectrophotometer, with the exception of black levels which are measured with an i1Display Pro colorimeter. Data is collected and examined using SpectraCal's CalMAN software.
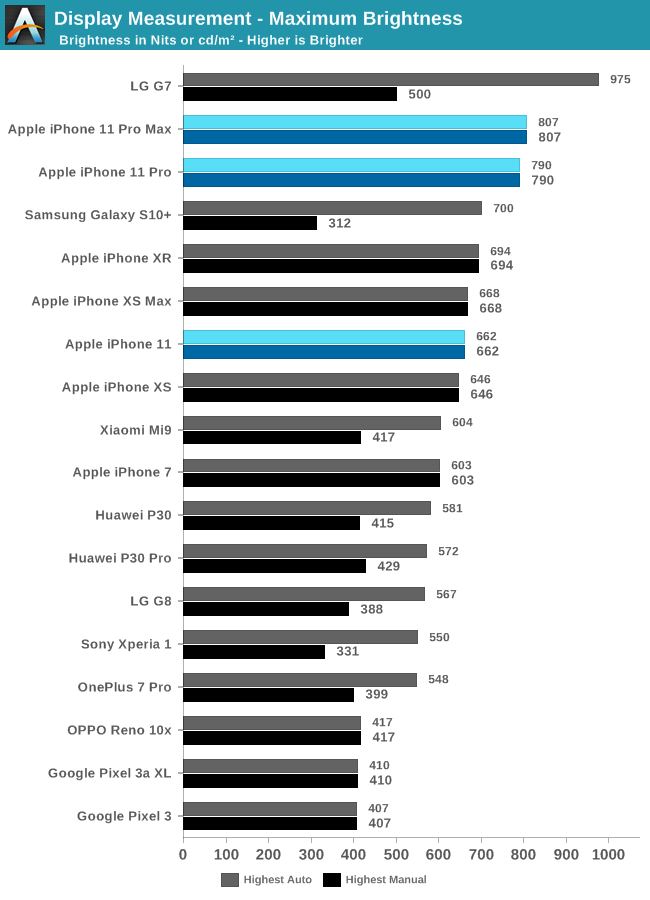
In terms of maximum brightness, Apple has advertised that the new iPhone 11 Pro’s can reach up to 800nits of brightness displaying regular content. We’re able to verify this, as our 11 Pro Max sample reached 807 nits while the 11 pro reached 790 nits. Consequently, it’s quite odd to see that the LCD-based iPhone 11 is now the lowest brightness device in the line-up. As always, Apple doesn’t make use of any brightness boost mechanism and thus allows its peak brightness to be achieved in any scenario.
Apple also advertises that the screen does go up to 1200 peak brightness in HDR content, however I haven’t been able to go ahead to verify this in our current test suite.
SpectraCal CalMAN
iPhone 11:
iPhone 11 Pro:
iPhone 11 Pro Max:
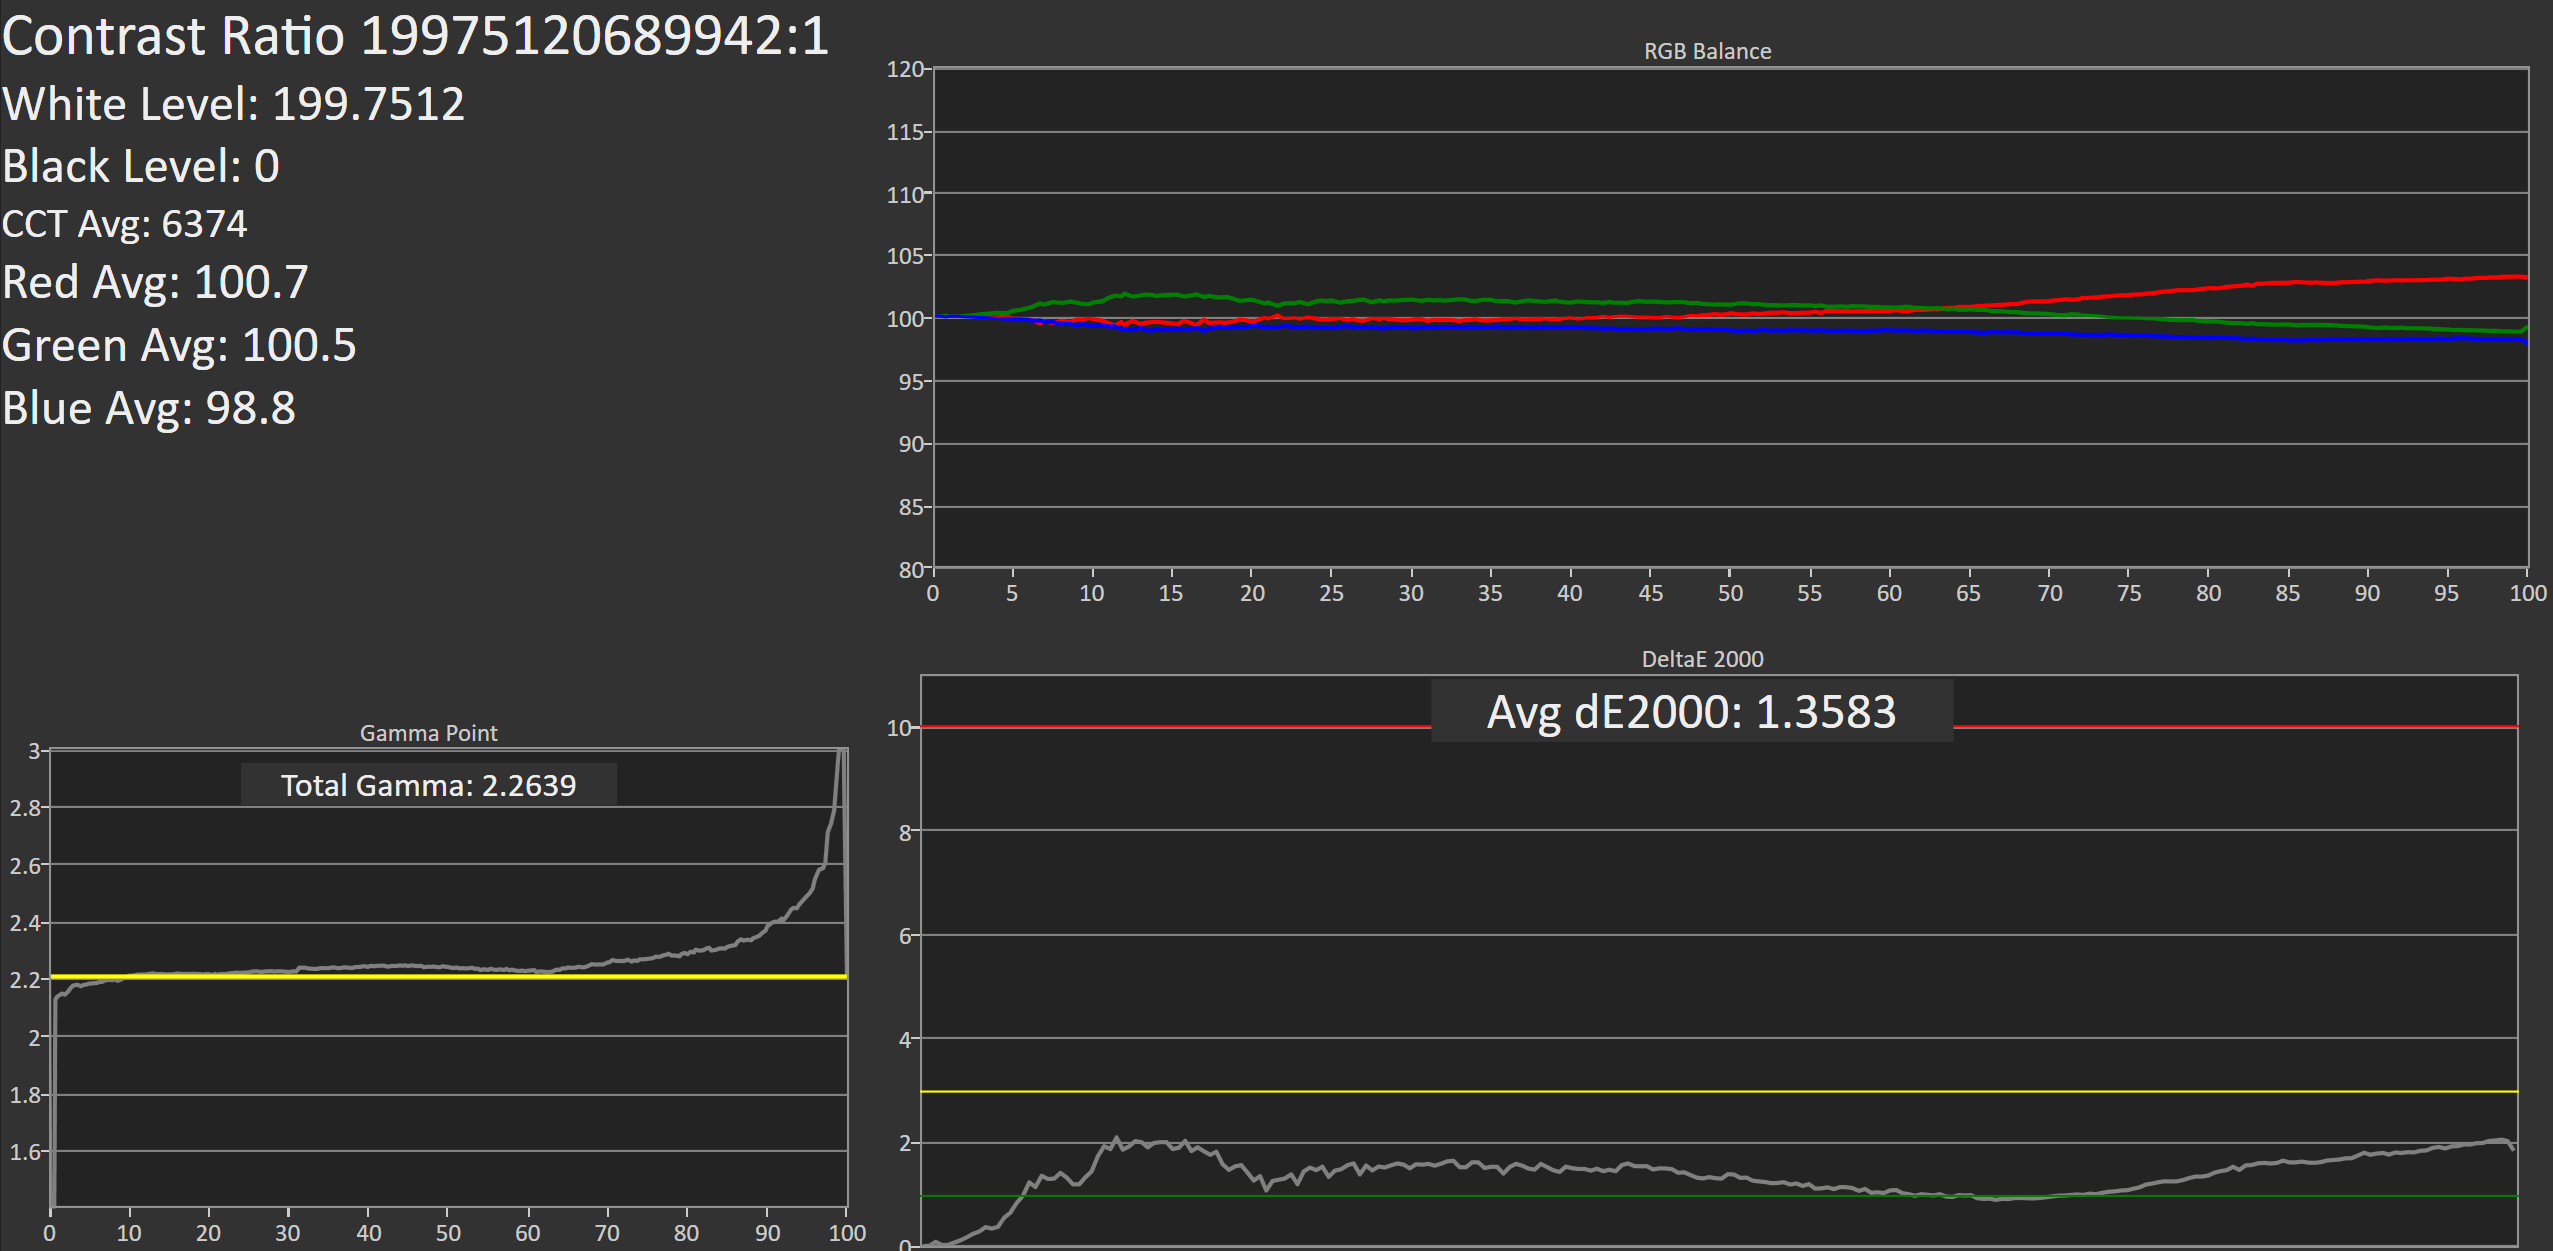
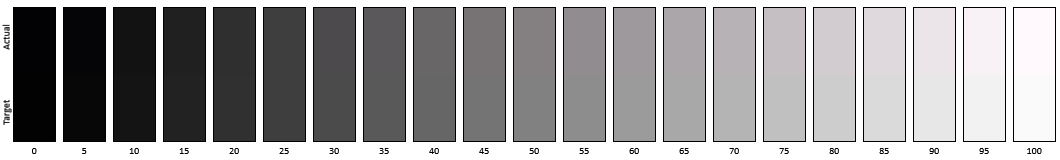
In the greyscale tests, all the iPhones perform extremely well, as expected. The Pro models do showcase a tendency to have slightly too strong red levels, so their color temperature is ever so slightly too warm. This characteristic diminishes the higher in brightness we go on the Pro models. The iPhone 11 has a weakness in the greens, so its color temperature is a above the 6500K white point target.
Gamma levels are excellent and target levels of 2.2. The Pro models are veering off towards higher gamma at higher picture levels, something that isnt as prominently exhibited by the iPhone 11. I’m not sure if this is due to a non-linear APL compensation of the phone screen during our measurement patterns, or if there’s an actual issue of the calibration.
iPhone 11 / SpectraCal CalMAN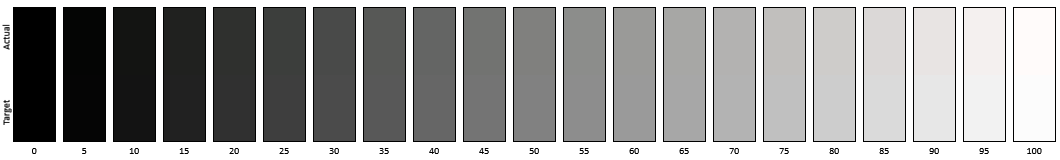
iPhone 11 Pro / SpectraCal CalMAN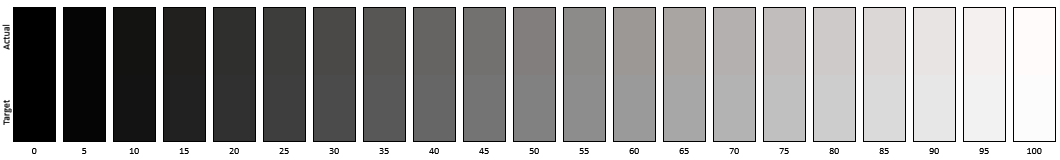
iPhone 11 Pro Max / SpectraCal CalMAN
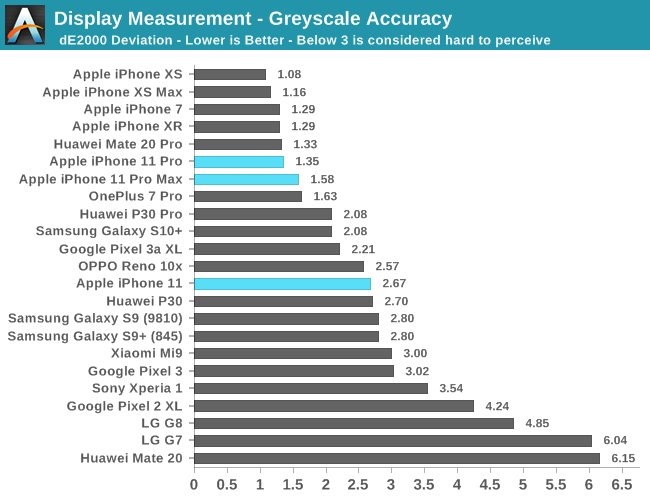
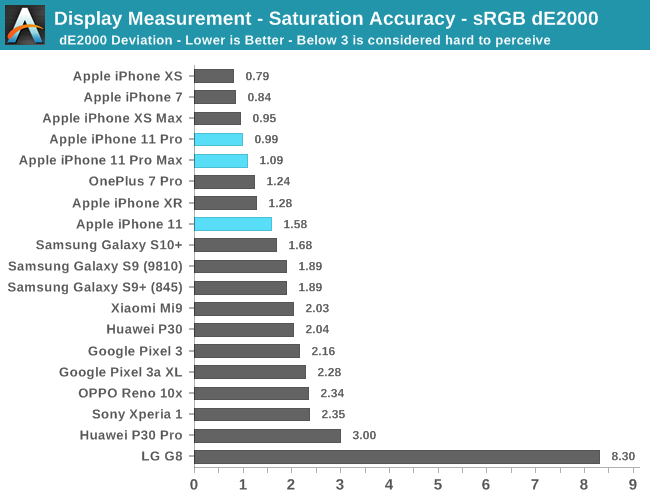
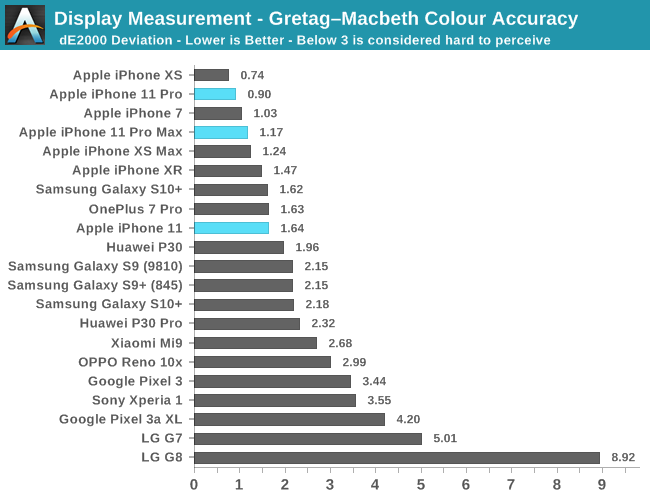
The dE2000 deviation scores for the Pro models this year are slightly worse than what we saw in last year’s XS devices, however it’s still firmly among the best in class devices out there in the market, and you’d be hard pressed to perceive the small deviations. The iPhone 11 oddly enough does fare a bit worse off than the iPhone XR due to the larger deviations in color balance.

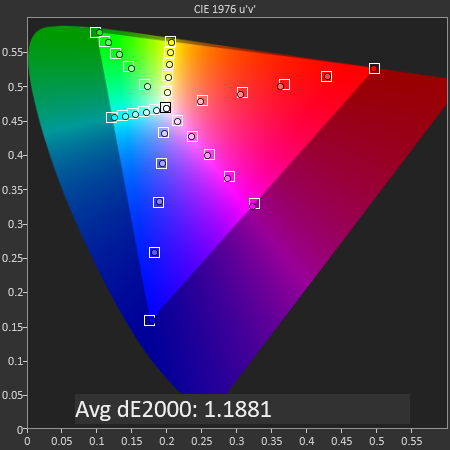
iPhone 11 / SpectraCal CalMAN
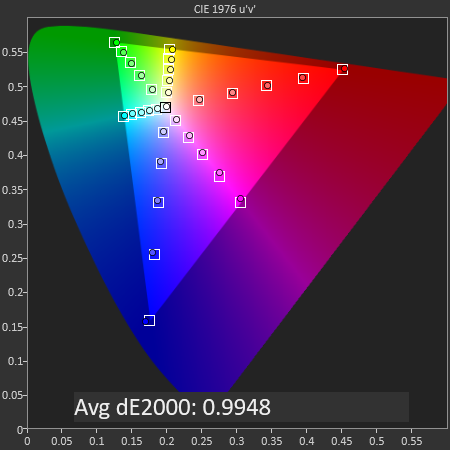
In the sRGB color space (default device content), the iPhone 11 performs extremely well with only minor shifts in hue in the greens.
iPhone 11 Pro / SpectraCal CalMAN

iPhone 11 Pro Max / SpectraCal CalMAN
In the same test, both the Pro models are showcasing exemplary accuracy.
The Pro models are just a bit worse off than the XS models of last year, but again these are among the most accurate displays you’ll find out there – mobile devices or not. The iPhone 11 is still excellent, although showing a bit larger deviation compared to the XR.
iPhone 11 / SpectraCal CalMAN

iPhone 11 Pro / SpectraCal CalMAN

iPhone 11 Pro Max / SpectraCal CalMAN
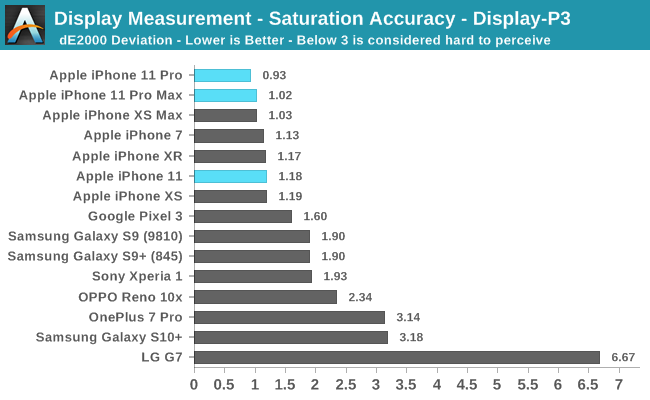
For Display P3 content, the iPhone 11 Pro models showcase the best saturation accuracies we’ve ever measured on any display. This time around, the iPhone 11 is in line with the XR.
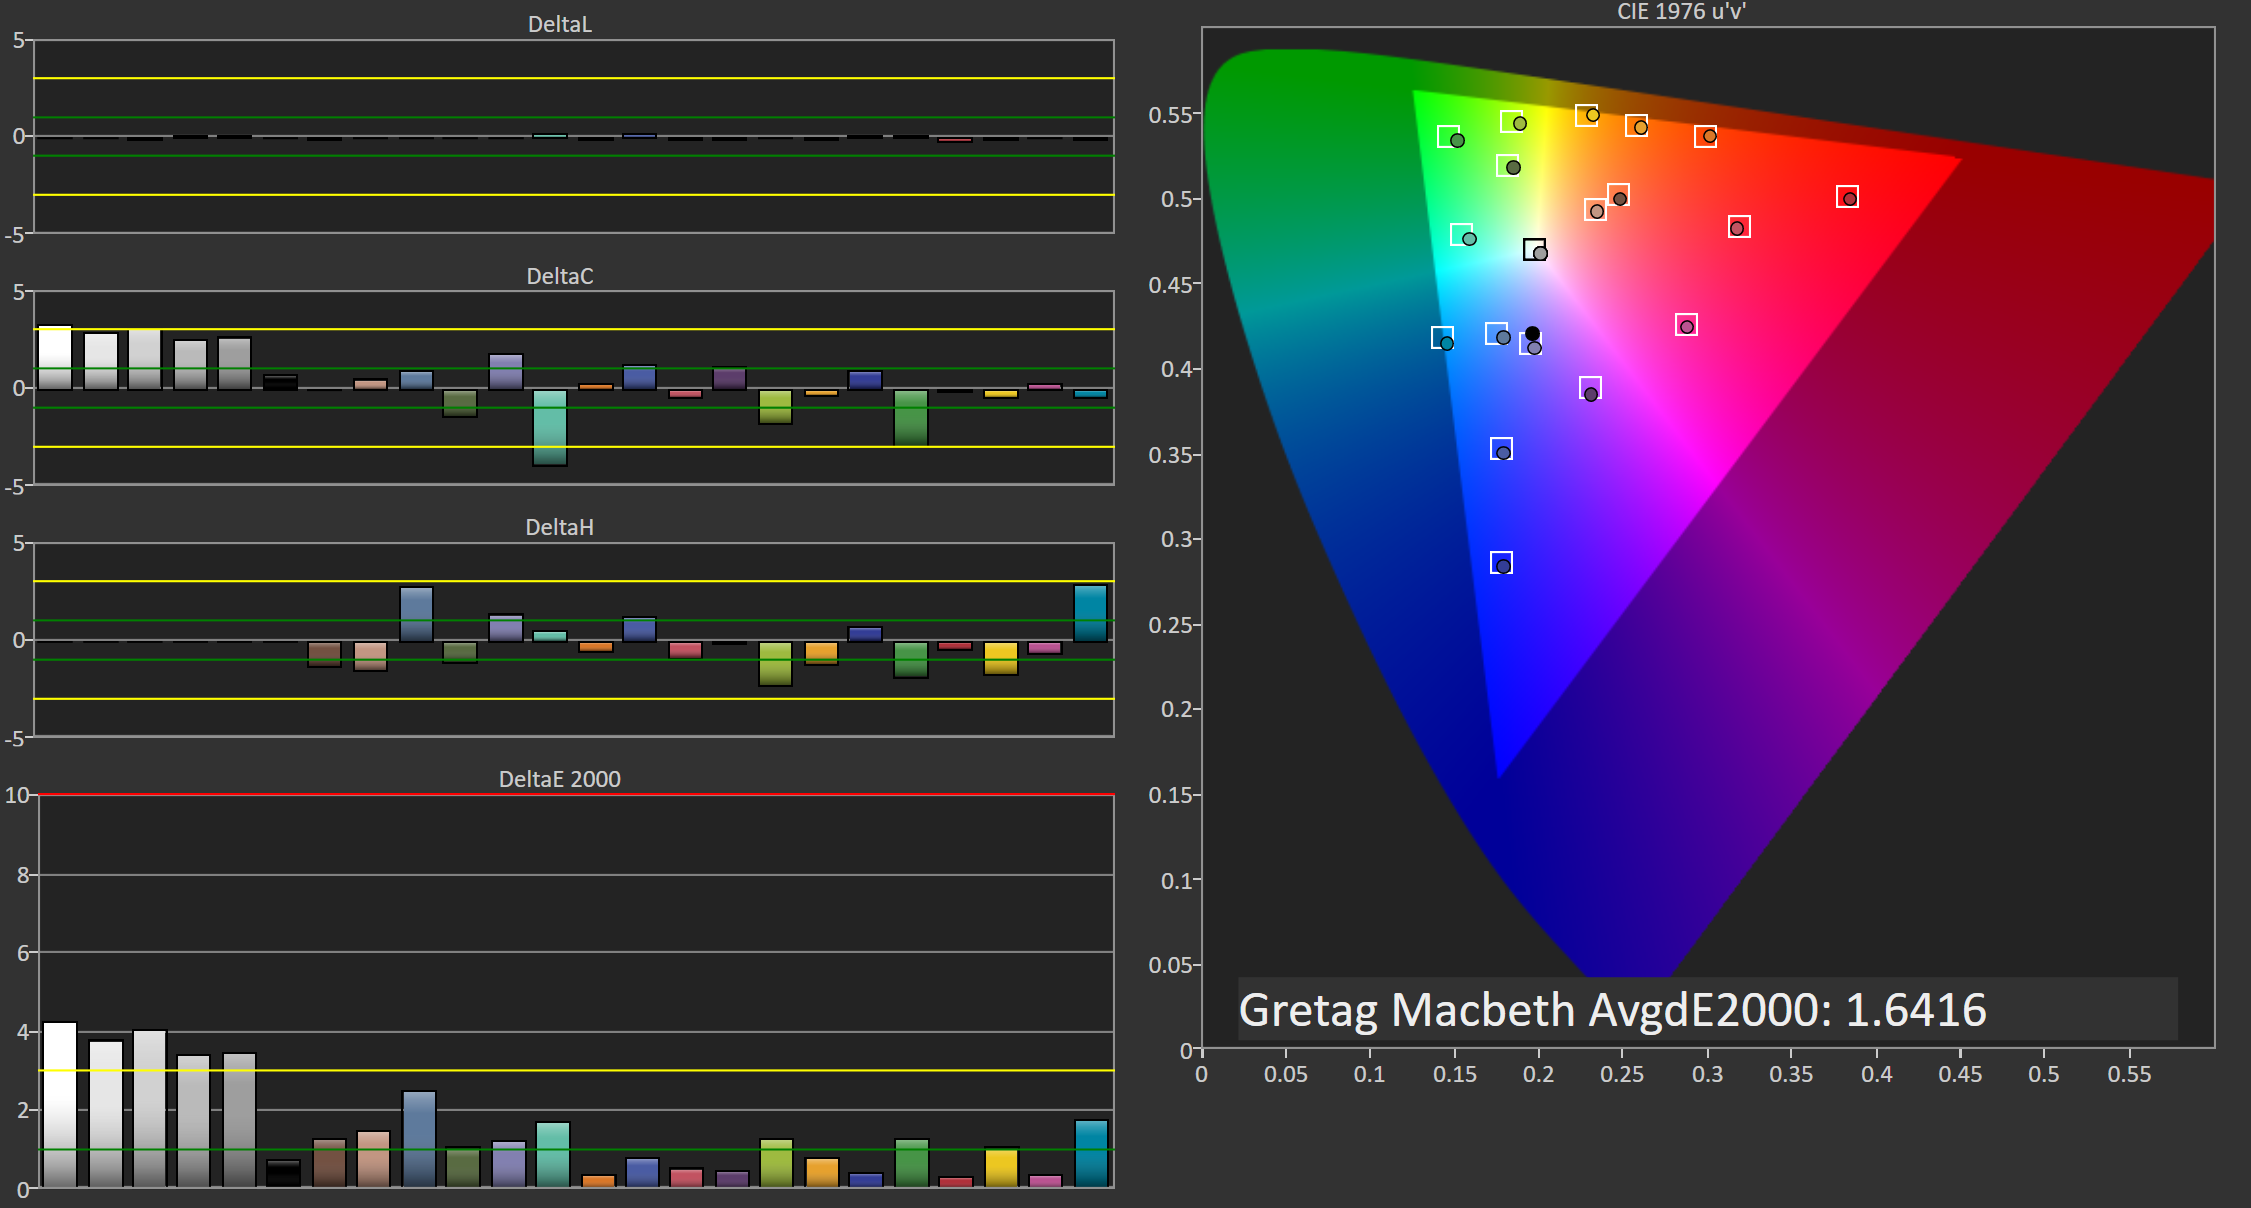
iPhone 11 / SpectraCal CalMAN
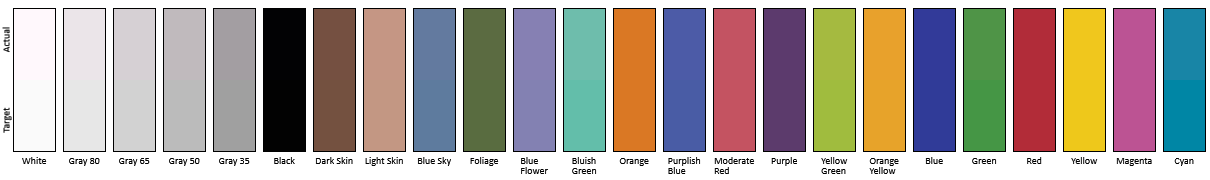
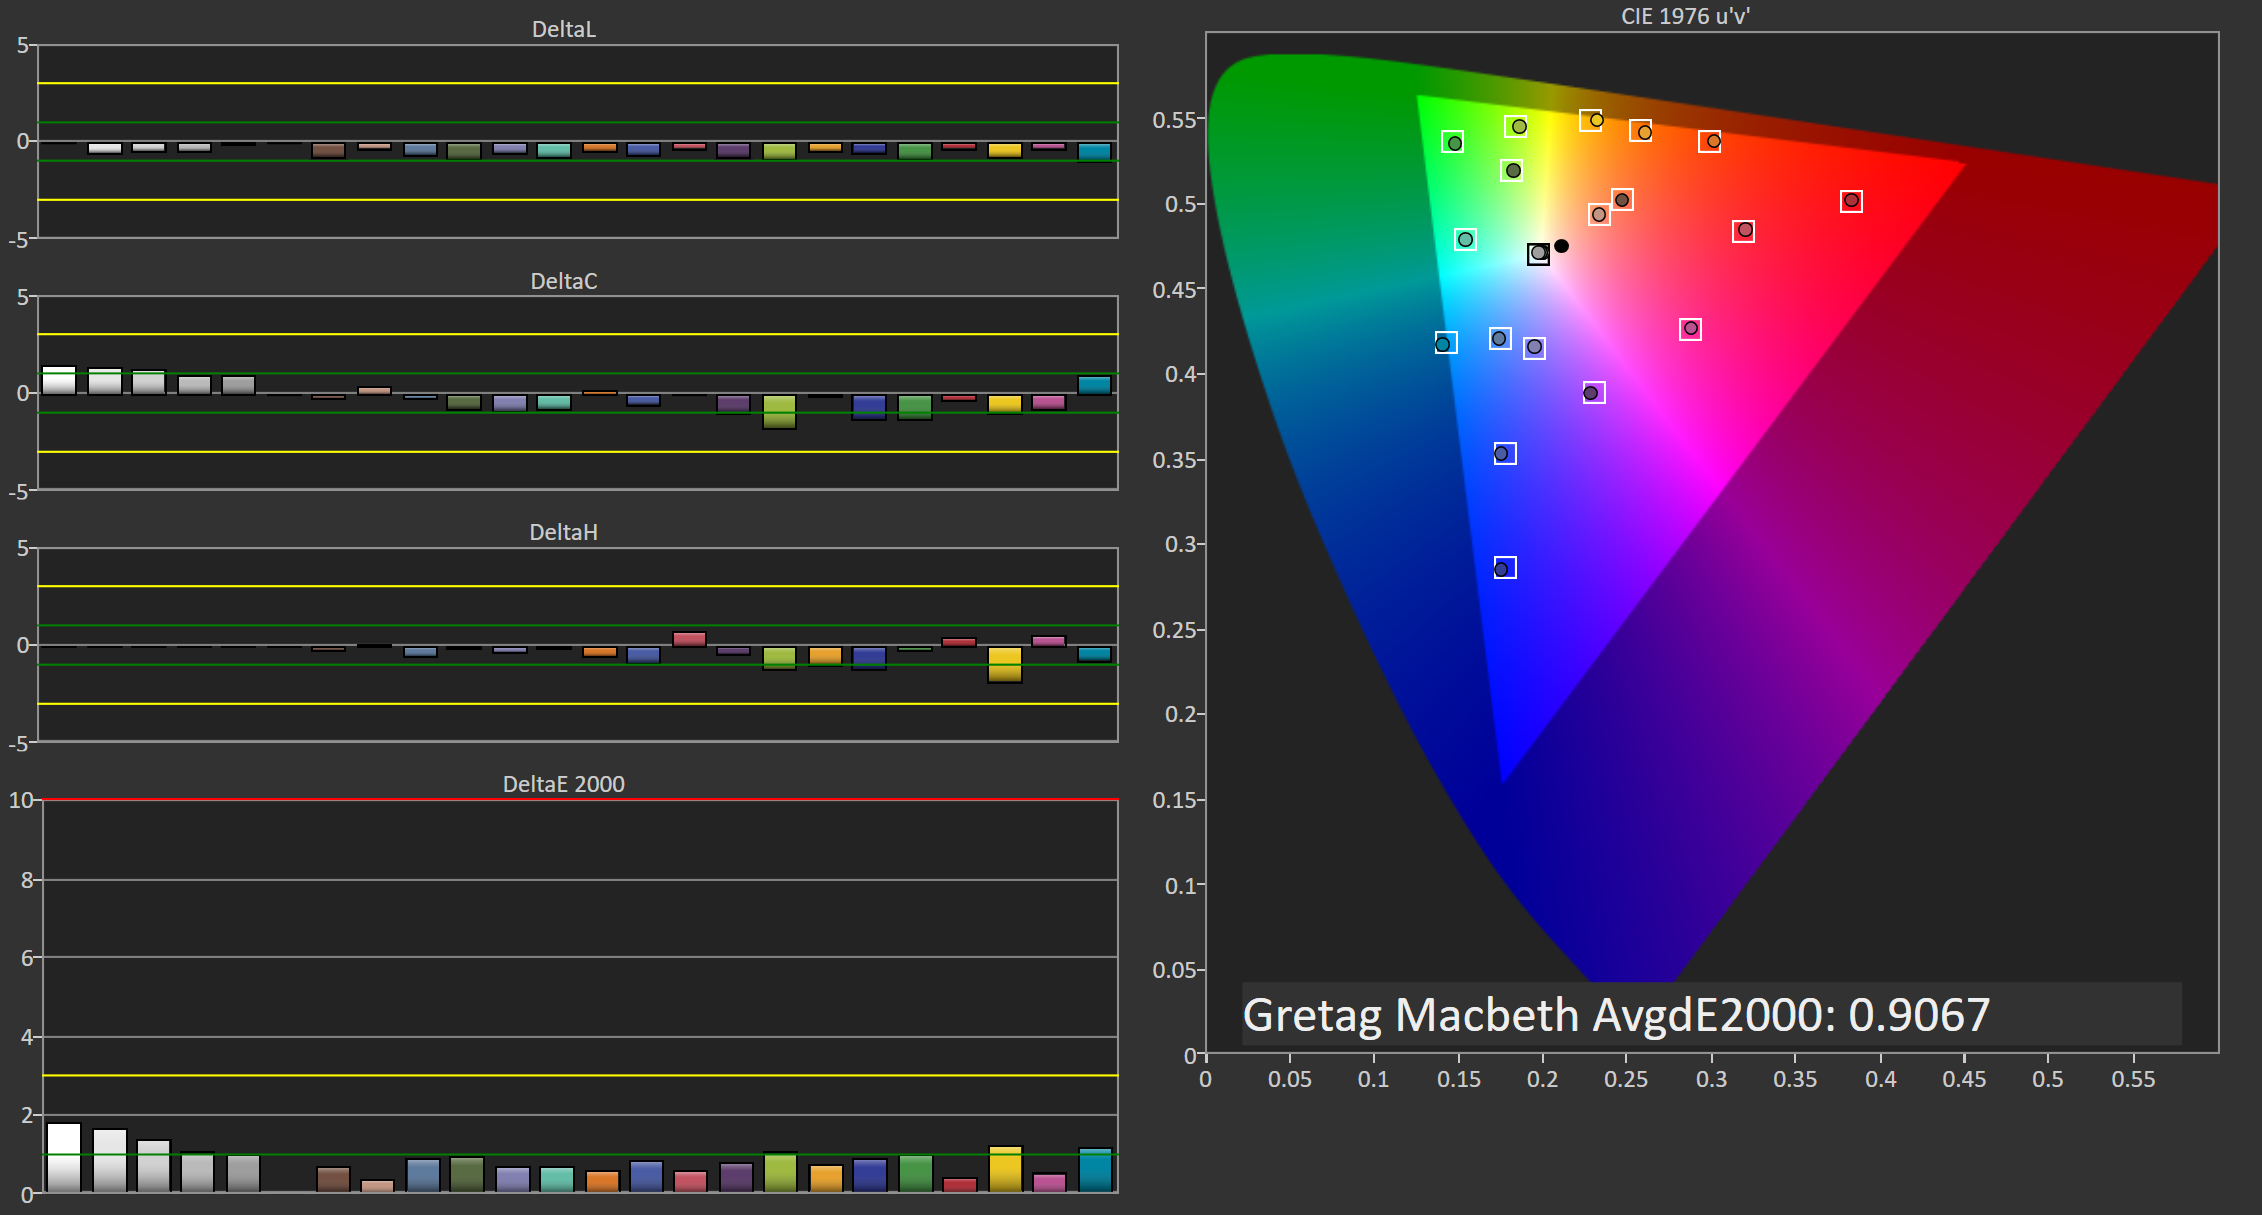
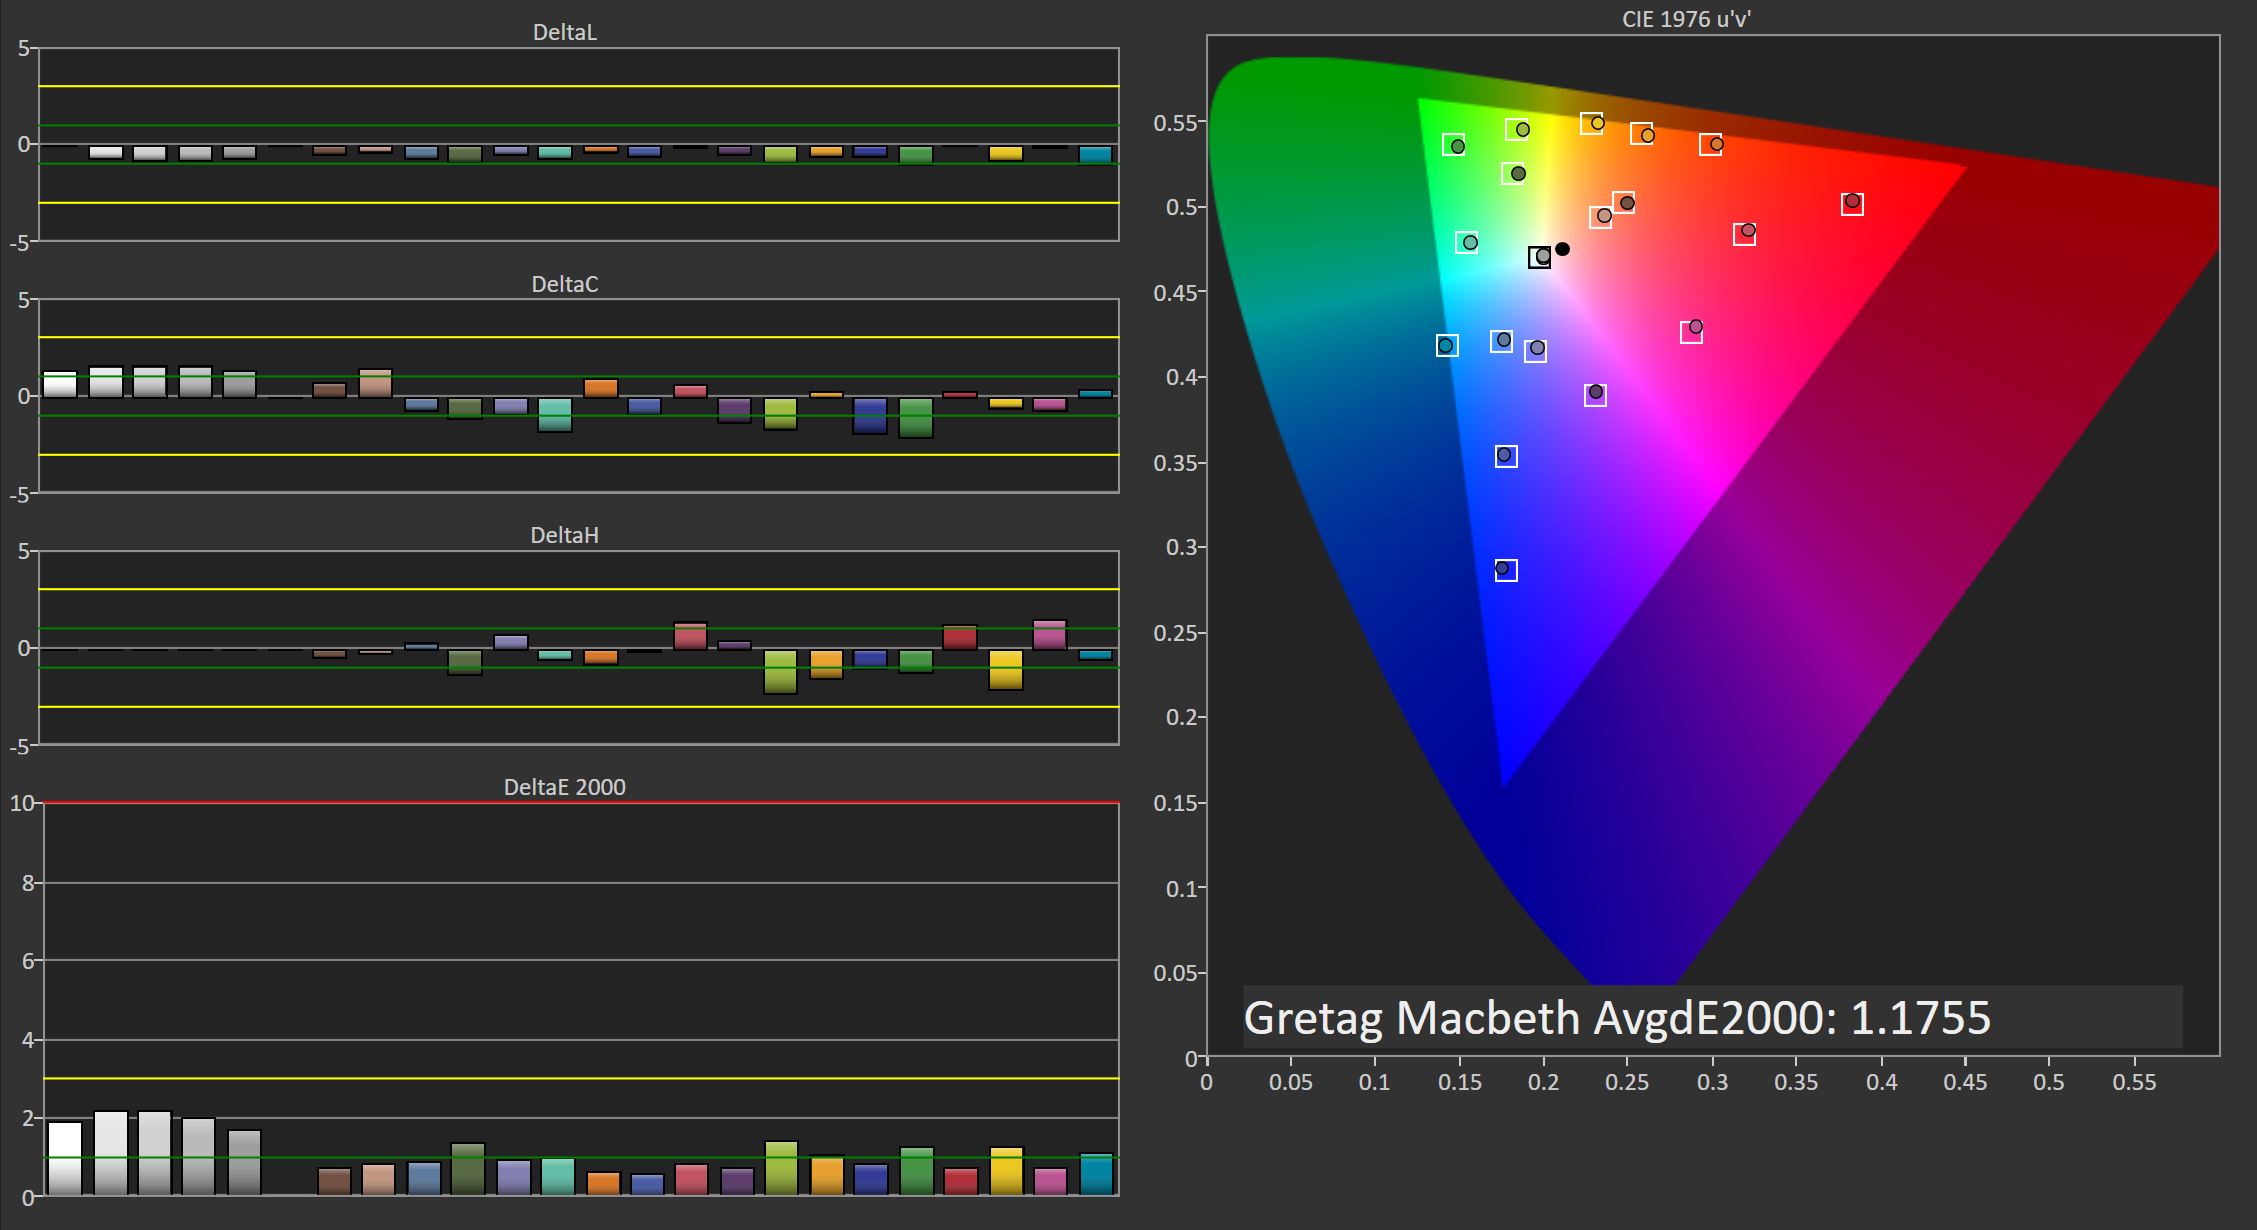
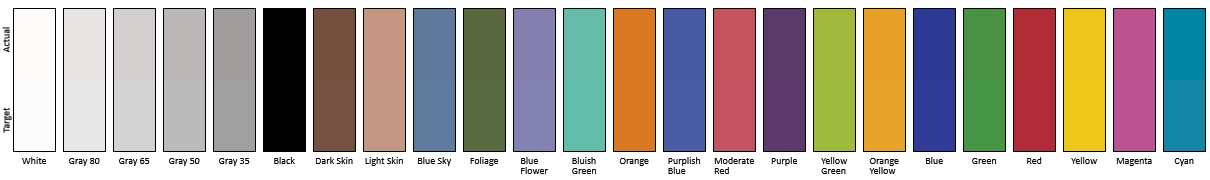
In the Gretag-MacBeth test of common tones, the only real issue of the iPhone 11 is the whites which had showcased a weakness of greens. Notice how the luminosity of the tones are essentially absolutely perfect.

iPhone 11 Pro / SpectraCal CalMAN
iPhone 11 Max Pro / SpectraCal CalMAN
Overall in terms of the color calibration and screen quality, the iPhones are the very best in the industry. There’s really nothing I can say about them as they’re class-leading in every regard.
The iPhone 11’s LCD screen isn’t for my taste due to the lower resolution, which frankly does bother me, and it certainly doesn’t have the same contrast characteristics as the Pro models. So while colors are still extremely good, it remains a compromise in 2019 when essentially every manufacturer has moved on to adopt OLED screens.
Display Power Measurements - Generational Improvements
Naturally, we didn’t want to finish the display evaluation section without verifying Apple’s claims about the new improved power efficiency of the iPhone 11 Pro panels.
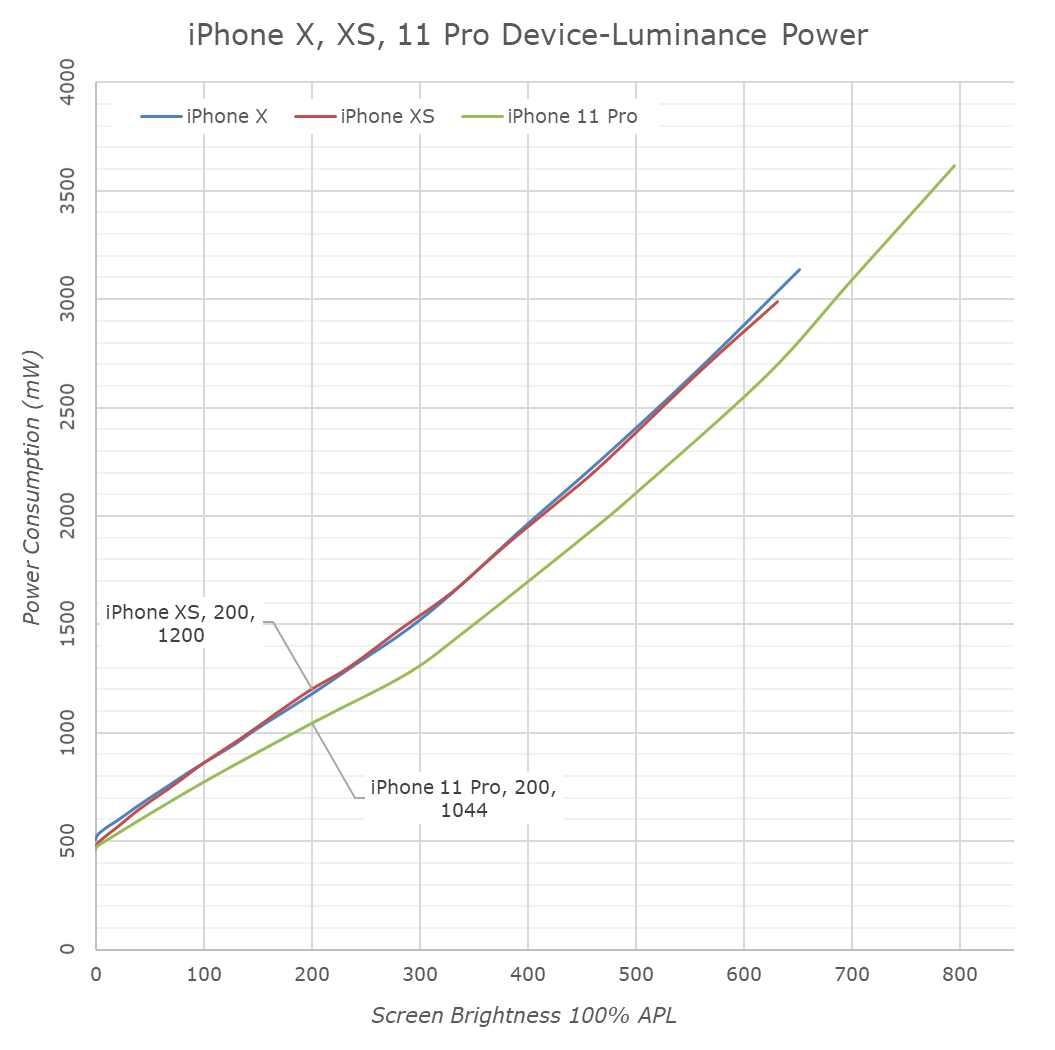
Comparing the three generations of identical format iPhones, we again see that the display power consumption between the original iPhone X and the XS didn’t differ much at all. Plotting the new iPhone 11 Pro in the chart however we immediately see the difference in the new generation.
At equal brightness levels, Apple has indeed been able to improve the power efficiency of the panel by 15% - just as Apple’s marketing described it. We also see how the new panel expands past the brightness limits of the X and XS, reaching 800nits. This does come at a cost however, as the improved power efficiency isn’t able to completely make up for the larger brightness increase, so the maximum power consumption of the screen displaying full white does rise from 2.6W to 3.1W.


242 Comments
View All Comments
Andrei Frumusanu - Monday, October 21, 2019 - link
The ROG2 is in the charts. It's getting good scores because it's the only S855+ phone in the charts, because the Adreno 640 has extremely high ALU performance, and because the phone itself is allowed to reach much higher temperatures than the iPhones.The benchmark *tests* are the exact same other than being run on different APIs. What's being rendered is identical between iOS and Android is the exact same.
techsorz - Monday, October 21, 2019 - link
Very nice, I think you should write that in your review. Although taking an iPhone review and then starting off with exploiting its apparent weakness on the first graph, which is the only thing most people will read, isn't very objective in my opinion. I also generally think it's better craftmanship to run benchmarks that have received updates on both devices, regardless.I mean, opening 3Dmark on the new iPhone literally starts it up in an iPhone 8 compatibiltiy mode. You can tell by how the UI doesn't even border the entire display. I just don't see a single compelling argument as to why you would ever pick this tool.
techsorz - Monday, October 21, 2019 - link
Hi Andrei, I see that you updated the review. I apologise for my harsh tone, thank you for this discussion, I learned a lot of new info.Andrei Frumusanu - Monday, October 21, 2019 - link
I updated absolutely nothing ...............techsorz - Monday, October 21, 2019 - link
Oh so you are here, why are you not addressing my point ?Andrei Frumusanu - Monday, October 21, 2019 - link
What point? The UI is irrelevant, the test is offscreen.techsorz - Monday, October 21, 2019 - link
Okay, i'll just have to quote yourself then:" I’ve actually gone back and quickly retested the iPhone XS on iOS13 and did see a 20% increase in performance compared to what we see in the graphs here; " - Andrei Frumusanu
And here is the knockout:
" the workload is running on Metal and the iOS version is irrelevant in that regard." - Andrei Frumusanu
Jesus christ, pull yourself together and fix your god damn review.
People reading, you can make your own conclusion here.
Andrei Frumusanu - Monday, October 21, 2019 - link
There is nothing to fix and there is nothing wrong with the benchmark, you went from the test being old and broken, to talking about it throttling differently because it's older, to the UI being an issue when it's completely irrelevant. The scores are what they are because that's the performance of the chip.The physics test sucks on Apple because it's one weakness in their microarchitecture: https://benchmarks.ul.com/news/understanding-3dmar...
techsorz - Monday, October 21, 2019 - link
Are you literally quoting an article from 2013 to prove something? I didn't go from anywhere, it IS old and broken. The score does NOT represent the throttling you would expect on updated software and certainly can NOT be graphed and compared with the Android version. It is BS that the app renders the same thing, you have literally 0 way of knowing since you didn't write the code.And I didn't go "herp derp, the UI is small" - I said that the app is so ancient that it literally boots in compatibility mode for the iPhone 8. And it is a real thing, go ahead and check the developer forums.
"The scores are what they are because that's the performance of the chip." ...
" I’ve actually gone back and quickly retested the iPhone XS on iOS13 and did see a 20% increase in performance compared to what we see in the graphs here; "
Comeone dude, stop it.
Andrei Frumusanu - Monday, October 21, 2019 - link
The THROTTLING has nothing to do with the software version or and GPU driver updates that Apple makes to improve performance. The improved drivers on the A12 in iOS13 do NOT change the throttling % between peak performance and sustained, which is a PHYSICAL characteristic of the phone.The workloads renders the SAME SCENE both on Android and iOS. We work closely with Futuremark, the developer of the benchmark, along with the developers of GFXBench. If you cannot accept this you have no place reading AT as I can not do anything more to convince you of basic facts regarding the testing.
The compatibility mode you blarb about is related to the UI resolution. It DOES NOT matter in any way for the test as it's been rendered off-screen in our suite. The performance results DO NOT CHANGE.
I am completely done with this topic.