QLC Goes To 8TB: Samsung 870 QVO and Sabrent Rocket Q 8TB SSDs Reviewed
by Billy Tallis on December 4, 2020 8:00 AM ESTSequential Read Performance
Our first test of sequential read performance uses short bursts of 128MB, issued as 128kB operations with no queuing. The test averages performance across eight bursts for a total of 1GB of data transferred from a drive containing 16GB of data. Between each burst the drive is given enough idle time to keep the overall duty cycle at 20%.
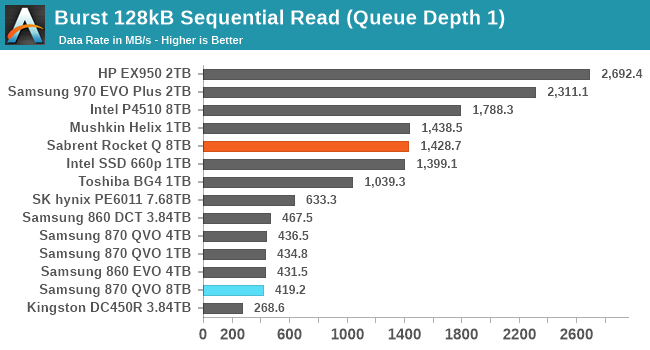
Both of the 8TB QLC SSDs provide burst sequential read performance that is on par for their respective market segments. The Sabrent Rocket Q performs similarly to both the Mushkin Helix DRAMless TLC and Intel 660p QLC SSDs. The 8TB Samsung 870 QVO is just a bit slower than the other Samsung SATA SSDs.
Our test of sustained sequential reads uses queue depths from 1 to 32, with the performance and power scores computed as the average of QD1, QD2 and QD4. Each queue depth is tested for up to one minute or 32GB transferred, from a drive containing 64GB of data. This test is run twice: once with the drive prepared by sequentially writing the test data, and again after the random write test has mixed things up, causing fragmentation inside the SSD that isn't visible to the OS. These two scores represent the two extremes of how the drive would perform under real-world usage, where wear leveling and modifications to some existing data will create some internal fragmentation that degrades performance, but usually not to the extent shown here.
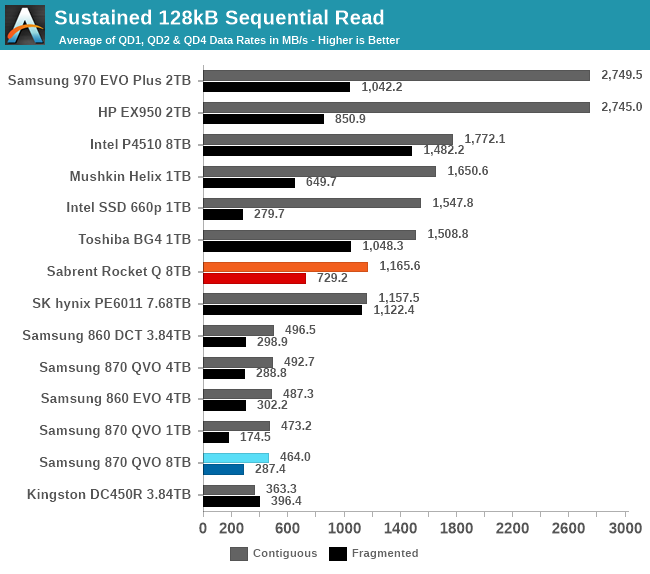
On the longer sequential read tests, the Sabrent Rocket Q starts to fall behind the other low-end NVMe drives, though it still offers competitive performance reading data that was written with random writes. The Samsung 870 QVO holds on to its status as only slightly slower than the other Samsung SATA drives, but due to the SATA bottleneck this is still far slower than any of the NVMe drives.
 |
|||||||||
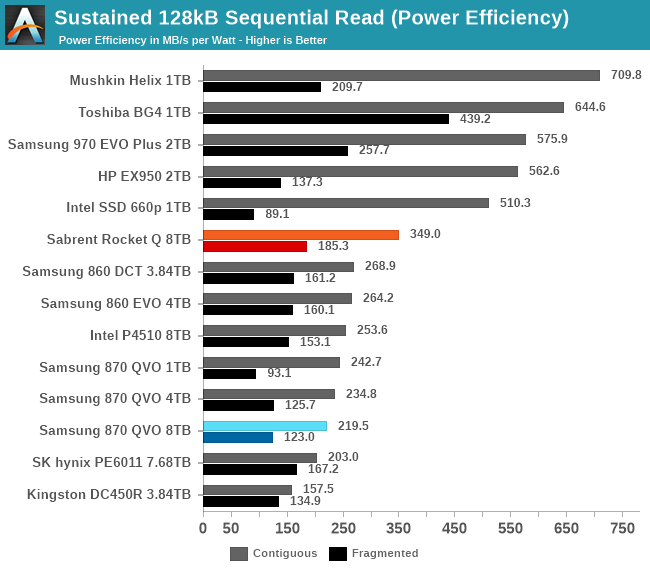
| Power Efficiency in MB/s/W | Average Power in W | ||||||||
The Sabrent Rocket Q is clearly the least efficient consumer NVMe drive in this bunch for sequential reads of contiguous data; the DRAMless TLC drives outperform it while using much less power, and the more power-hungry high-end TLC SSDs have higher performance to match. The 8TB Samsung 870 QVO again scores just a bit worse than its lower-capacity siblings, because the 8TB model is slightly slower and draws slightly more power.
 |
|||||||||
Like many Phison-based NVMe SSDs, the Sabrent Rocket Q's sequential read performance doesn't really begin to scale up until queue depths go beyond 4, explaining its poor low-QD scores above. By QD16 it is basically saturating the PCIe 3 x4 interface. The Samsung 870 QVO saturates the SATA interface starting at QD2.
 |
|||||||||
| Sabrent Rocket Q 8TB | Samsung 870 QVO 8TB | ||||||||
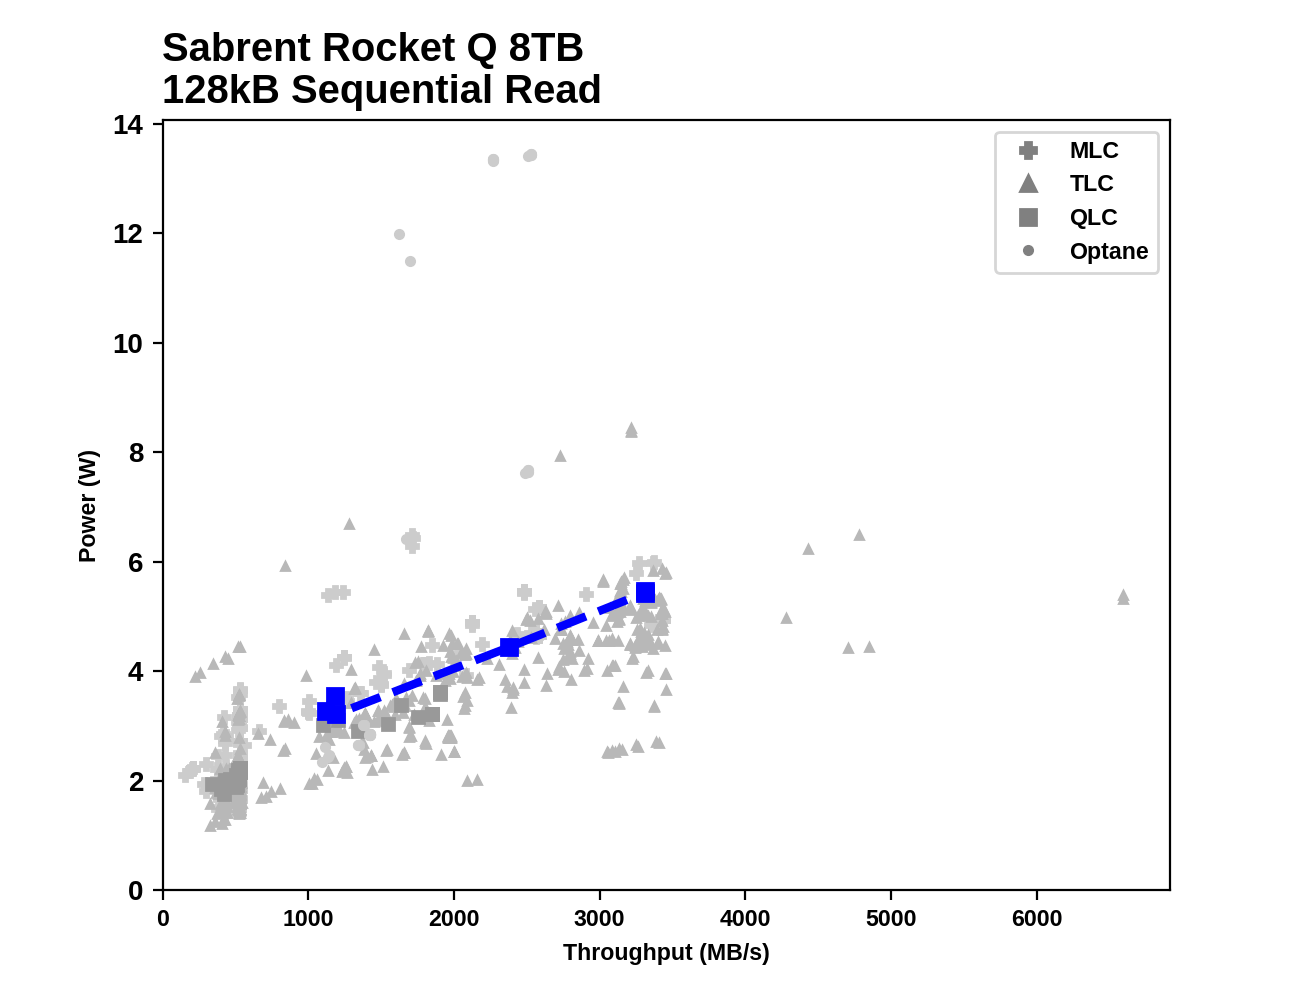
While both 8TB drives saturate their respective host interfaces with sequential reads when the queue depths are sufficiently high, they also both draw more power than average among our entire collection of test results. However, neither is power-hungry enough to stand out as an outlier from that crowd.
Sequential Write Performance
Our test of sequential write burst performance is structured identically to the sequential read burst performance test save for the direction of the data transfer. Each burst writes 128MB as 128kB operations issued at QD1, for a total of 1GB of data written to a drive containing 16GB of data.
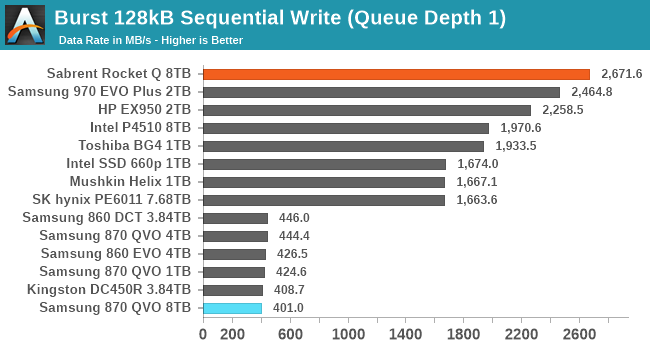
The burst sequential write test primarily illustrates SLC cache performance, and the Sabrent Rocket Q does quite well here, outperforming the rest of the NVMe drives in this bunch. The 8TB Samsung 870 QVO is the slowest drive, but is only slightly slower than the other SATA drives.
Our test of sustained sequential writes is structured identically to our sustained sequential read test, save for the direction of the data transfers. Queue depths range from 1 to 32 and each queue depth is tested for up to one minute or 32GB, followed by up to one minute of idle time for the drive to cool off and perform garbage collection. The test is confined to a 64GB span of the drive.
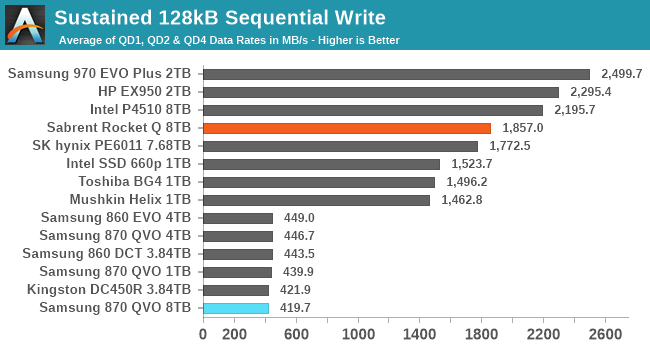
On the longer sequential write test, the Rocket Q falls behind the high-end consumer NVMe drives but remains clearly faster than the other budget NVMe drives. Meanwhile, the 8TB 870 QVO stays in last place, but is not actually meaningfully slower than the other SATA drives.
 |
|||||||||
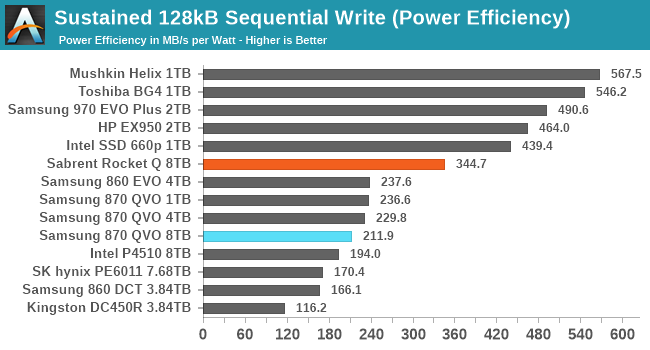
| Power Efficiency in MB/s/W | Average Power in W | ||||||||
The Sabrent Rocket Q has the worst power efficiency among the consumer NVMe drives during the sequential write test, but it still offers better performance per Watt than the SATA drives. The 8TB 870 QVO has a lower efficiency score than the other consumer SATA drives, but the enterprise drives are even worse.
 |
|||||||||
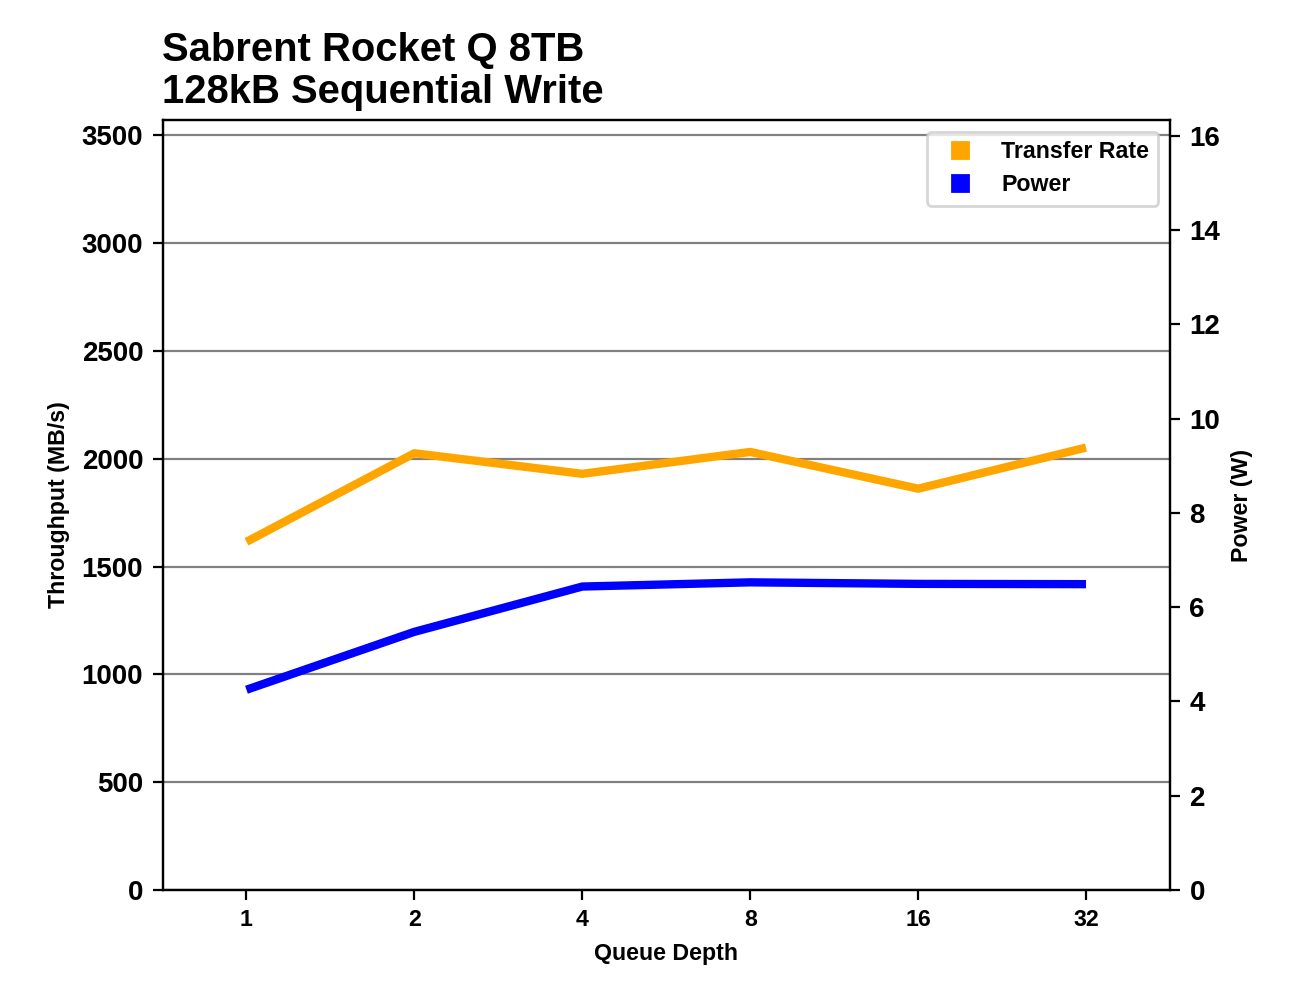
Both of the 8TB QLC drives hit their full sequential write speed at QD2 and maintain it for the rest of the test without the SLC cache running out. However, the performance from the Rocket Q is a somewhat variable, probably indicating that it is affected by background work the controller is doing to flush the SLC cache.
 |
|||||||||
| Sabrent Rocket Q 8TB | Samsung 870 QVO 8TB | ||||||||
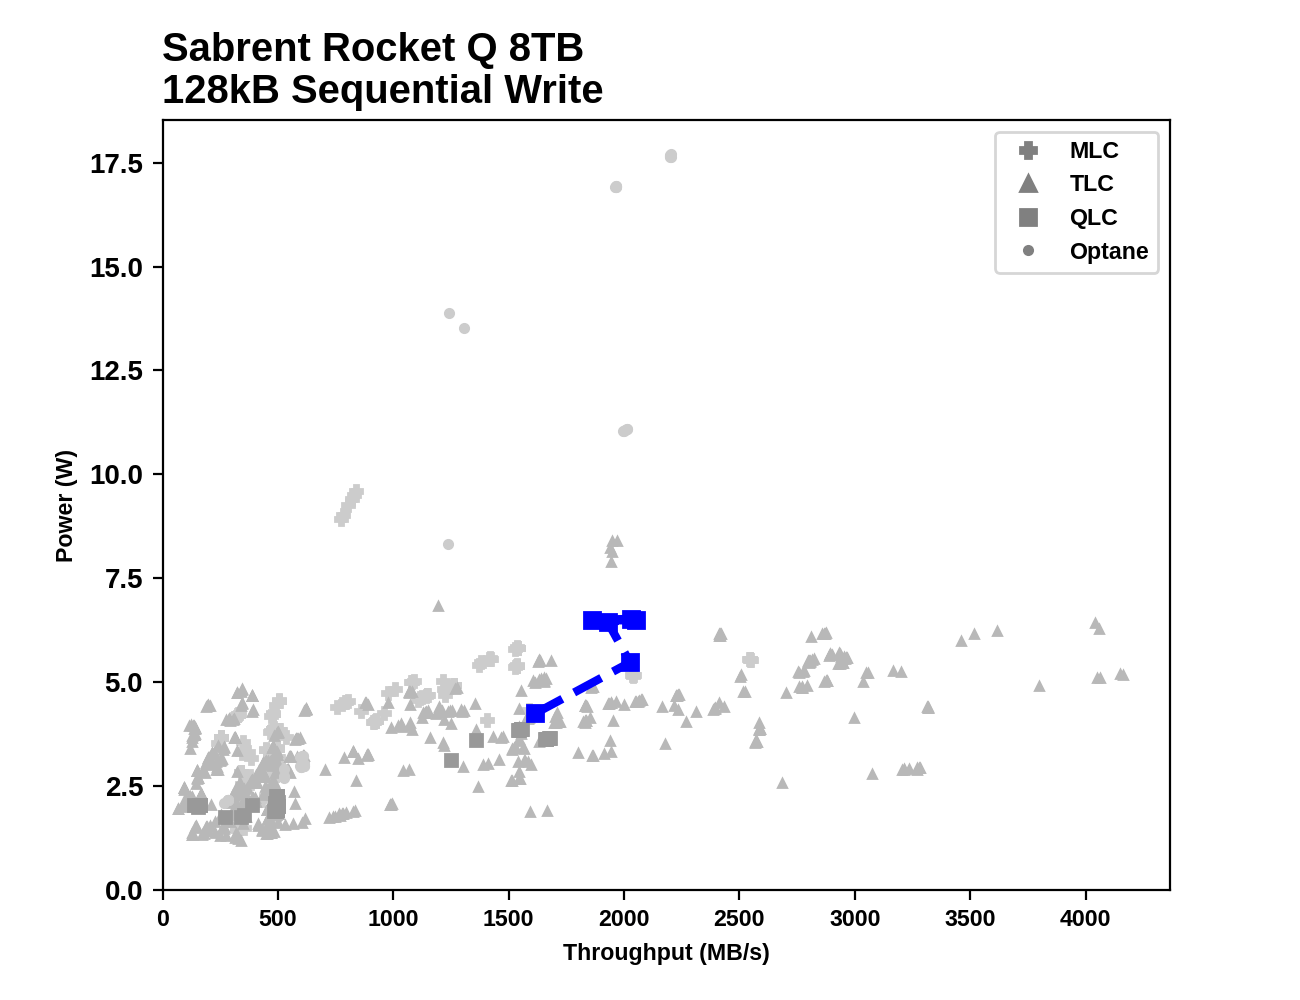
Plotted against the full set of results from all the SATA SSDs we've tested, the performance and power consumption of the 8TB 870 QVO on the sequential write test appears to be good but not pushing any limits. The Rocket Q's performance is higher than most entry-level NVMe drives, but its power consumption creeps up to unusually high levels (over 6W).


150 Comments
View All Comments
heffeque - Friday, December 4, 2020 - link
No worries on a NAS: BTRFS will take care of that in the background.Billy Tallis - Friday, December 4, 2020 - link
Not sure if that's a joke about BTRFS RAID5/6 ensuring you lose your data.A BTRFS scrub isn't automatic; you need a cron job or similar to automate periodic scrubbing. But assuming you do that and stay away from the more dangerous/less tested RAID modes, you shouldn't have to worry about silent data loss. I've been using BTRFS RAID1 with various SSDs as my primary NAS ever since I amassed enough 1 and 2TB models, and it's worked well so far. ZFS would also work reasonably well, but it is less convenient when you're using a pile of mismatched drives.
Getting back to the question of data retention of QLC itself: the write endurance rating of a drive is supposed to be chosen so that at the end of the rated write endurance the NAND is still healthy enough to provide 1 year unpowered data retention. (For client/consumer drives; for enterprise drives the standard is just 3 months, so they can afford to wear out the NAND a bit further, and that's part of why enterprise drives have higher TBW ratings.)
heffeque - Wednesday, December 9, 2020 - link
BTRFS background self-healing is automatic in Synology as of DSM 6.1 and above.TheinsanegamerN - Saturday, December 5, 2020 - link
Long term cold storage of any flash memory is terrible. QLC wont be any better then TLC in this regard.Oxford Guy - Sunday, December 6, 2020 - link
How could it possibly be better (than 3D TLC)?It can only be worse unless the TLC is really shoddy quality. This is because it has 16 voltage states rather than 8.
TheinsanegamerN - Monday, December 7, 2020 - link
Hence why I said it wont be any better, because it cant be. That leaves the door open for it to be worse.Reeding iz hard.
Oxford Guy - Monday, December 7, 2020 - link
But your comment obviously wasn't clear enough, was it?QLC is worse than TLC. Next time write that since that's the clear truth, not that QLC and TLC are somehow equivalent.
joesiv - Friday, December 4, 2020 - link
I love the idea of 8TB SSD drives, it's the perfect size for a local data drive, I could finally be rid of my spinning rust! Just need the price to drop a bit, maybe next year!Thank you for the review. Though I wish reviews of SSD's would be more clear to consumers what endurance really means to the end user. "DWPD" and TB/D, are mentioned, noone seems to highlight the fact that, it's not end user's writes that matter in these specifications, it's "writes to nand", which can be totally different from user/OS writes. It is reliant on the firmware, and some firmwares do some wonky things for data collection, speed, or even have bugs, which drastically drop the endurance of a drive.
Of course I would love an exhaustive endrance test in the review, at the bare minimum, if anandtech could check the smart data after the benchmark is done, and verify two things, it would give you some useful information.
Check:
- nand writes (average block erases is usually available)
- OS writes (sometimes is not easily available), but since you run a standardized bench suite, perhaps you have an idea of how many GB's you typically run through your drives anyways.
You might need to do a bit of math on the block erase count, to get it back to GBs, and you might need to contact the manufacturer for SMART data attribute documentation, but if they don't have good smart data attributes, or documentation available, perhaps it's something to highlight in the review.
But then you could weed out, and present to the consumer drives that have firmwares have outrageously inefficient nand write patterns.
My company has had several failures, and because of that, have had to test in this way potential drives for our products, and have had to outright skip drives that's specs were great, but the firmwares were doing very inefficient drive writes, limiting their endurance.
anyways, feedback, and fingers crossed!
Keep up the good work, and thanks for the quality content!
heffeque - Friday, December 4, 2020 - link
Well... 2 TB per day every day seems like a lot of writes. Not sure it'll be a problem for normal use.joesiv - Friday, December 4, 2020 - link
well firmware bugs can cause writes to be magnified 10x, 100x higher than what is expected. I've seen it. So, you're 2TB's, would just be 20GB's... Of course we hope that firmwares don't have such bugs, but how would we know unless someone looked at the numbers?