QLC Goes To 8TB: Samsung 870 QVO and Sabrent Rocket Q 8TB SSDs Reviewed
by Billy Tallis on December 4, 2020 8:00 AM ESTSequential Read Performance
Our first test of sequential read performance uses short bursts of 128MB, issued as 128kB operations with no queuing. The test averages performance across eight bursts for a total of 1GB of data transferred from a drive containing 16GB of data. Between each burst the drive is given enough idle time to keep the overall duty cycle at 20%.
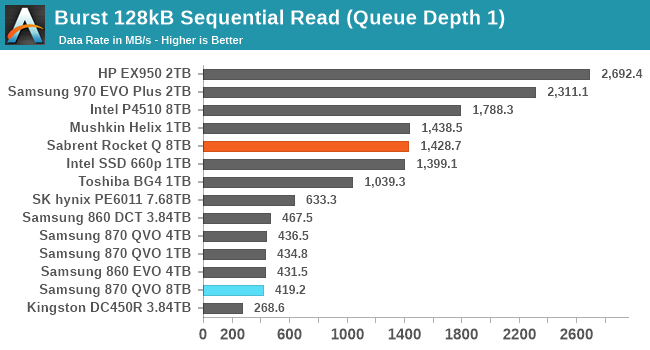
Both of the 8TB QLC SSDs provide burst sequential read performance that is on par for their respective market segments. The Sabrent Rocket Q performs similarly to both the Mushkin Helix DRAMless TLC and Intel 660p QLC SSDs. The 8TB Samsung 870 QVO is just a bit slower than the other Samsung SATA SSDs.
Our test of sustained sequential reads uses queue depths from 1 to 32, with the performance and power scores computed as the average of QD1, QD2 and QD4. Each queue depth is tested for up to one minute or 32GB transferred, from a drive containing 64GB of data. This test is run twice: once with the drive prepared by sequentially writing the test data, and again after the random write test has mixed things up, causing fragmentation inside the SSD that isn't visible to the OS. These two scores represent the two extremes of how the drive would perform under real-world usage, where wear leveling and modifications to some existing data will create some internal fragmentation that degrades performance, but usually not to the extent shown here.
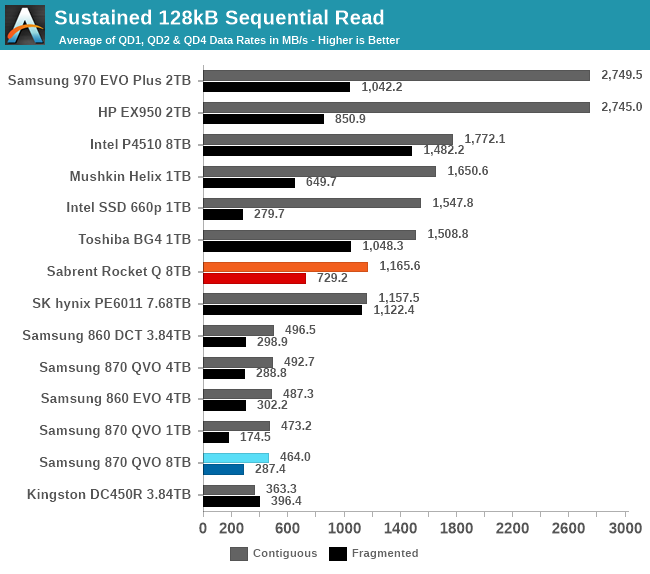
On the longer sequential read tests, the Sabrent Rocket Q starts to fall behind the other low-end NVMe drives, though it still offers competitive performance reading data that was written with random writes. The Samsung 870 QVO holds on to its status as only slightly slower than the other Samsung SATA drives, but due to the SATA bottleneck this is still far slower than any of the NVMe drives.
 |
|||||||||
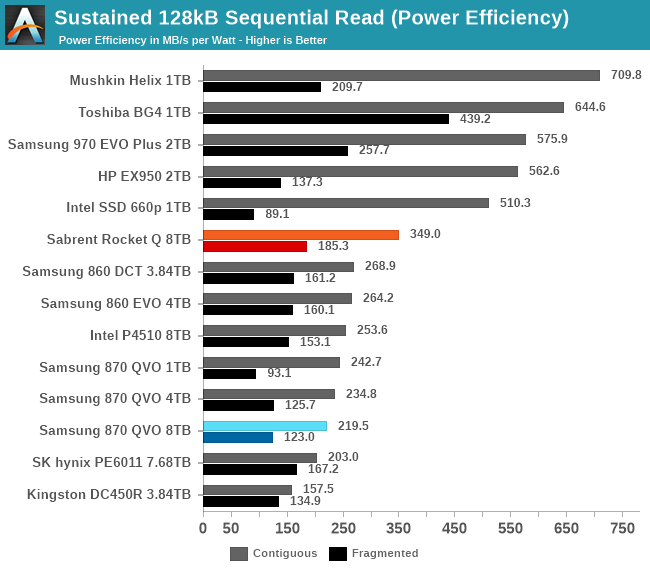
| Power Efficiency in MB/s/W | Average Power in W | ||||||||
The Sabrent Rocket Q is clearly the least efficient consumer NVMe drive in this bunch for sequential reads of contiguous data; the DRAMless TLC drives outperform it while using much less power, and the more power-hungry high-end TLC SSDs have higher performance to match. The 8TB Samsung 870 QVO again scores just a bit worse than its lower-capacity siblings, because the 8TB model is slightly slower and draws slightly more power.
 |
|||||||||
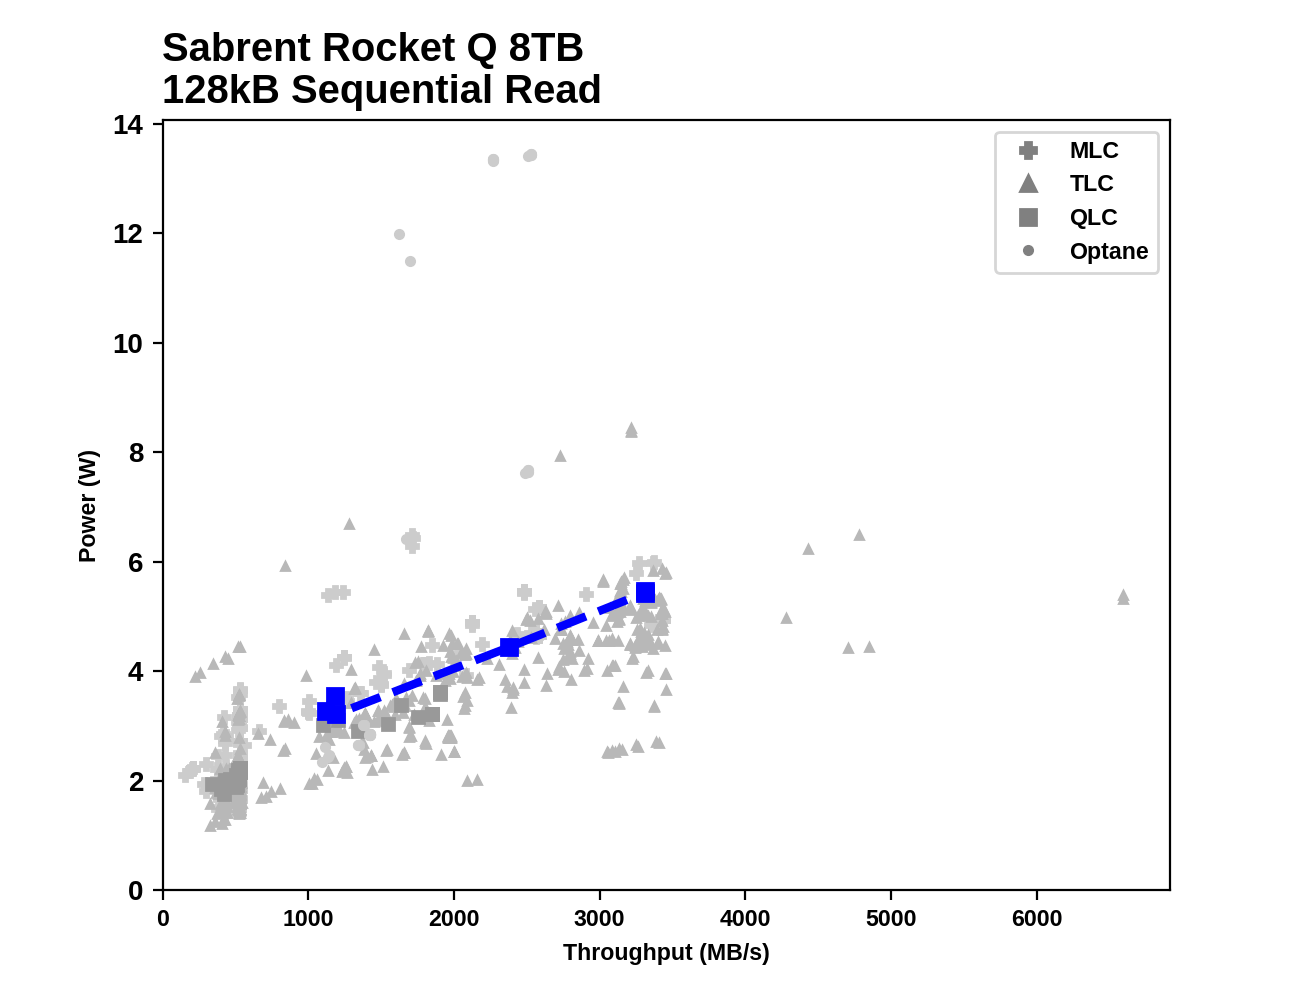
Like many Phison-based NVMe SSDs, the Sabrent Rocket Q's sequential read performance doesn't really begin to scale up until queue depths go beyond 4, explaining its poor low-QD scores above. By QD16 it is basically saturating the PCIe 3 x4 interface. The Samsung 870 QVO saturates the SATA interface starting at QD2.
 |
|||||||||
| Sabrent Rocket Q 8TB | Samsung 870 QVO 8TB | ||||||||
While both 8TB drives saturate their respective host interfaces with sequential reads when the queue depths are sufficiently high, they also both draw more power than average among our entire collection of test results. However, neither is power-hungry enough to stand out as an outlier from that crowd.
Sequential Write Performance
Our test of sequential write burst performance is structured identically to the sequential read burst performance test save for the direction of the data transfer. Each burst writes 128MB as 128kB operations issued at QD1, for a total of 1GB of data written to a drive containing 16GB of data.
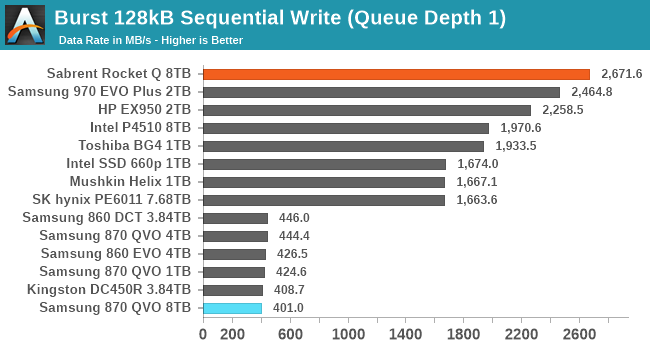
The burst sequential write test primarily illustrates SLC cache performance, and the Sabrent Rocket Q does quite well here, outperforming the rest of the NVMe drives in this bunch. The 8TB Samsung 870 QVO is the slowest drive, but is only slightly slower than the other SATA drives.
Our test of sustained sequential writes is structured identically to our sustained sequential read test, save for the direction of the data transfers. Queue depths range from 1 to 32 and each queue depth is tested for up to one minute or 32GB, followed by up to one minute of idle time for the drive to cool off and perform garbage collection. The test is confined to a 64GB span of the drive.
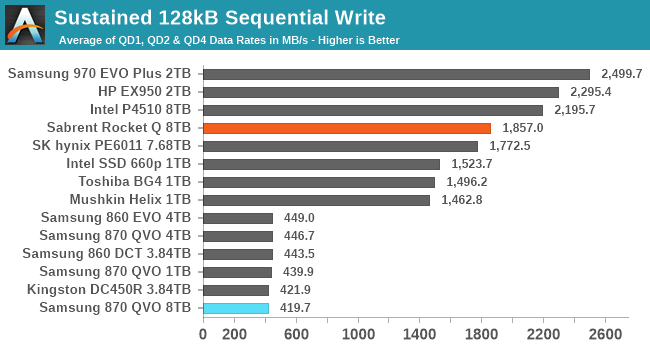
On the longer sequential write test, the Rocket Q falls behind the high-end consumer NVMe drives but remains clearly faster than the other budget NVMe drives. Meanwhile, the 8TB 870 QVO stays in last place, but is not actually meaningfully slower than the other SATA drives.
 |
|||||||||
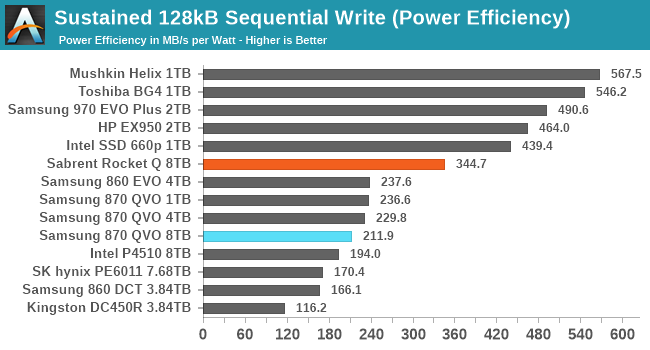
| Power Efficiency in MB/s/W | Average Power in W | ||||||||
The Sabrent Rocket Q has the worst power efficiency among the consumer NVMe drives during the sequential write test, but it still offers better performance per Watt than the SATA drives. The 8TB 870 QVO has a lower efficiency score than the other consumer SATA drives, but the enterprise drives are even worse.
 |
|||||||||
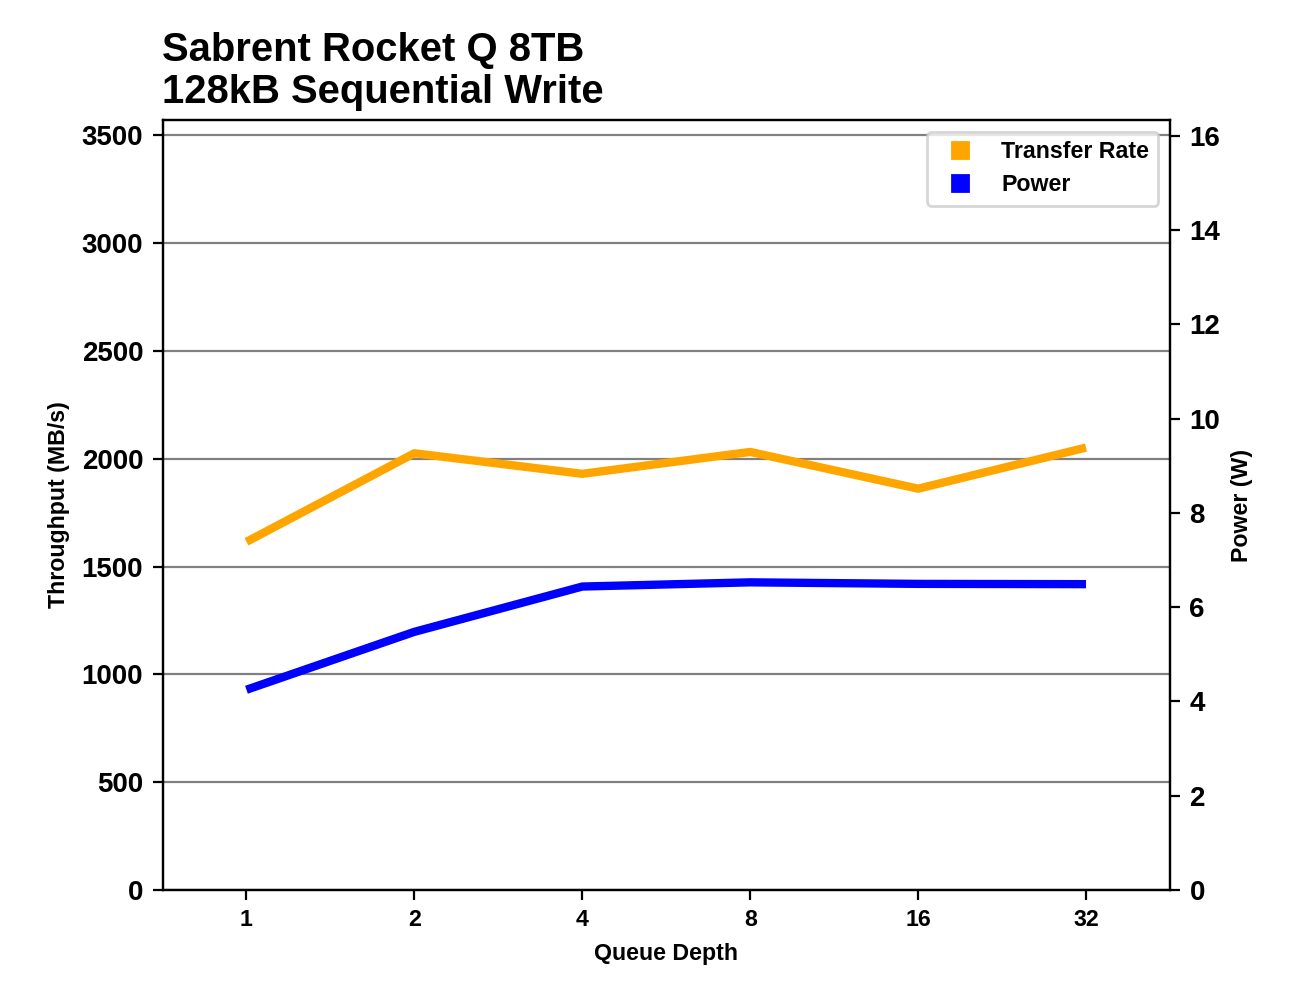
Both of the 8TB QLC drives hit their full sequential write speed at QD2 and maintain it for the rest of the test without the SLC cache running out. However, the performance from the Rocket Q is a somewhat variable, probably indicating that it is affected by background work the controller is doing to flush the SLC cache.
 |
|||||||||
| Sabrent Rocket Q 8TB | Samsung 870 QVO 8TB | ||||||||
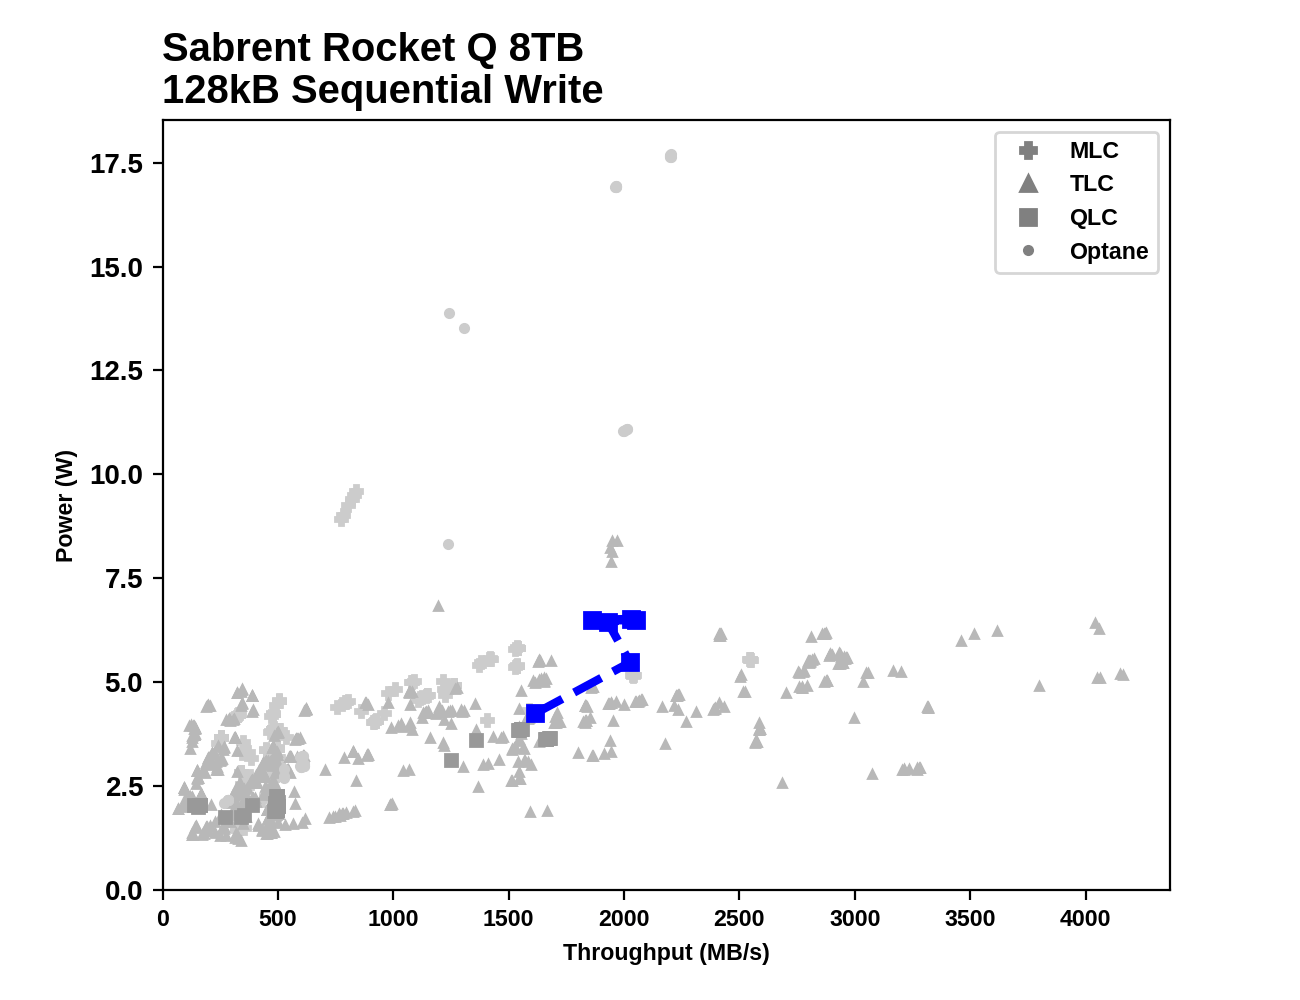
Plotted against the full set of results from all the SATA SSDs we've tested, the performance and power consumption of the 8TB 870 QVO on the sequential write test appears to be good but not pushing any limits. The Rocket Q's performance is higher than most entry-level NVMe drives, but its power consumption creeps up to unusually high levels (over 6W).


150 Comments
View All Comments
heffeque - Friday, December 4, 2020 - link
"Of course we hope that firmwares don't have such bugs, but how would we know unless someone looked at the numbers?"Well on a traditional HDD you also have to hope that they put Helium in it and not Mustard gas by mistake. It "can" happen, but how would we know if nobody opens every single HDD drive?
In a serious note, if a drive has such a serious firmware bug, rest assured that someone will notice, that it will go public quite fast and that it will end up getting fixed (like it has in the past).
Spunjji - Monday, December 7, 2020 - link
Thanks for responding to that "how do you know unless you look" post appropriately. That kind of woolly thinking really gets my goat.joesiv - Monday, December 7, 2020 - link
Well, I for one would rather not be the one that discovers the bug, and lose my data.I didn't experience this one, but it's an example of a firmware bug:
https://www.engadget.com/2020-03-25-hpe-ssd-bricke...
Where I work, I'm involved in SSD evaluation. A drive we used in the field had a nasty firmware bug, that took out dozens of our SSD's after a couple years of operation (that was well within their specs), The manufacturer fixed it in a firmware update, but not until a year + after release, so we shipped hundreds of product.
Knowing that, I evaluate them now. But for my personal use, where my needs are different, I'd love it if at least a very simple check was done in the reviews. It's not that hard, review the SSD, then check to see if the writes to NAND is reasonable given the workload you gave it. It's right there in the smart data, it'll be in block sizes, so you might have to multiply it by the block size, but it'll tell you a lot.
Just by doing something similar, we were able to vet a drive that was writing 100x more to NAND than it should have been, essentially it was using up it's life expectancy 1% per day! Working with the manufacturer, they eventually decided we should just move to another product, they weren't much into firmware fixes.
Anyways, someone should keep the manufactuers honest, why not start with the reviews?
Also, no offence, but what is the "wolly thinking" are you talking about? I'm just trying to protect my investment and data.
heffeque - Tuesday, December 8, 2020 - link
As if HDD didn't have their share of problems, both firmware and HW (especially the HW). I've seen loads of HDD die in the first 48 hours, then a huge percentage of them no later than a year afterwards.My experience is that SDD last A LOT longer and are A LOT more reliable than HDD.
While HDD had been braking every 1-3 years (and changing them was a high cost due to the remote location, and the high wages of Scandinavian countries), when we changed to SSD we had literally ZERO replacements to perform since then so... can't say that the experience with hundreds of SSD not failing vs hundreds of HDD that barely last a few years goes in favor of HDD in any kind of measure.
In the end, paying to send to those countries a slightly more expensive device (the SSD) has payed for itself several-fold in just a couple of years.
MDD1963 - Friday, December 4, 2020 - link
I've only averaged .8 TB per *month* over 3.5 years....joesiv - Monday, December 7, 2020 - link
Out of curiousity, how did you come to this number?Just be aware that SMART data will track different things. You're probably right, but SMART data is manufactuer and model dependant, and sometimes they'll use the attributes differently. You really have to look up the smart documentation for your drive, to be sure they are calculating and using the attributes the way your smart data utility is labeling them as. Some manfacturers also don't track writes to NAND.
I would look at:
"writes to nand" or "lifetime writes to flash" - which for some kingston drives is attribute 233
"SSD Life Left" - which for some ADATA drives is 232 (ADATA), and Micron/Crucial might be is 202), this is actually usually calculated based on average block erase count against the rated block erase counts the NAND is rated for (3000ish for MLC, much less for 3d nand)
A lot of maufactuers haven't included the actual NAND writes in their SMART data, so it'd be hard to get to, and should be called out for it (Delkin, Crucial).
"Total host writes" is what the OS wrote, and what most viewers assume is what manufactuers are stating when they're talking about drive writes per day or TB a day. That's the amount of data that is fed to the SSD, not what is actually written to NAND.
Also realize that wear leveling routines can eat up SSD life as well. I'm not sure how SLC mode that newer firmwars have affects life expectancy/nand writes actually.
stanleyipkiss - Friday, December 4, 2020 - link
Honestly, if the prices of these QLC high-capacity drives would drop a bit, I would be all over them -- especially for NAS use. I just want to move away from spinning mechanical drives but when I can get a 18 TB drive at the same price of a 4-8 TB SSD, I will choose the larger drive.Just make them cheaper.
Also: I would love HIGHER capacity, and I WOULD pay for it... Micron had some drives and I'm sure some mainstream drives could be made available -- if you can squeeze 8TB onto M.2 then you could certainly put 16TB on a 2.5 inch drive.
DigitalFreak - Monday, December 7, 2020 - link
Ask and ye shall receive.https://www.pcgamer.com/sabrent-is-close-to-launch...
Xex360 - Friday, December 4, 2020 - link
The prices don't make any sense, you can get multiple drives for the same capacity but less money and more performance and reliability, and should cost more because they use more material.inighthawki - Friday, December 4, 2020 - link
At least for the sabrent drive, M.2 slots can be at a premium, so it makes perfect sense for a single drive to cost more than two smaller ones. On many systems being able to hook up that many drives would require a PCIe expansion card, and if you're not just bifurcating an existing 8x or 16x lane you would need a PCIe switch which is going to cost you hundreds of dollars at minimum.