Intel NUC13 Extreme Raptor Canyon Review: Sizzling SFF Performance Powerhouse
by Ganesh T S on December 14, 2022 8:00 AM EST- Posted in
- Systems
- Intel
- NUC
- Raptor Lake
- Raptor Canyon
- NUC13
- NUC Extreme
System Performance: UL and BAPCo Benchmarks
Our 2022 Q4 update to the test suite for Windows 11-based systems carries over some of the standard benchmarks we have been using over the last several years, including UL's PCMark and BAPCo's SYSmark. New additions include BAPCo's CrossMark multi-platform benchmarking tool, as well as UL's Procyon benchmark suite.
UL PCMark 10
UL's PCMark 10 evaluates computing systems for various usage scenarios (generic / essential tasks such as web browsing and starting up applications, productivity tasks such as editing spreadsheets and documents, gaming, and digital content creation). We benchmarked select PCs with the PCMark 10 Extended profile and recorded the scores for various scenarios. These scores are heavily influenced by the CPU and GPU in the system, though the RAM and storage device also play a part. The power plan was set to Balanced for all the PCs while processing the PCMark 10 benchmark. The scores for each contributing component / use-case environment are also graphed below.
| UL PCMark 10 - Performance Scores | |||
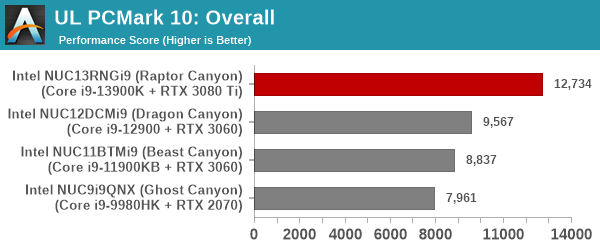
As expected, the Raptor Canyon NUC starts off with a healthy lead in the overall scores. This trend is inherent in all sub-components, with each NUC generation leap-frogging the previous one. The biggest jump is by the Raptor Canyon NUC.
UL Procyon v2.1.544
PCMark 10 utilizes open-source software such as Libre Office and GIMP to evaluate system performance. However, many of their professional benchmark customers have been requesting evaluation with commonly-used commercial software such as Microsoft Office and Adobe applications. In order to serve their needs, UL introduced the Procyon benchmark in late 2020. There are five benchmark categories currently - Office Productivity, AI Inference, Battery Life, Photo Editing, and Video Editing. AI Inference benchmarks are available only for Android devices, while the battery life benchmark is applicable to Windows devices such as notebooks and tablets. We presents results from our processing of the other three benchmarks.
| UL Procyon - Office Productivity Scores | |||
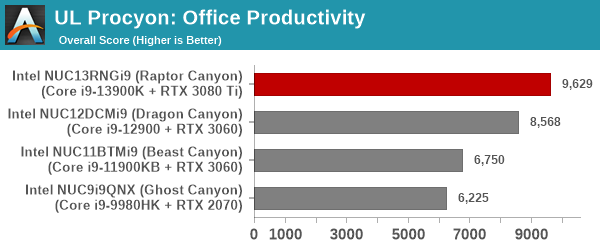
Taking only office workloads into consideration, the Raptor Canyon does perform significantly better that the Dragon Canyon, but the gulf is slightly smaller compared to the overall picture presented in the PCMark 10.
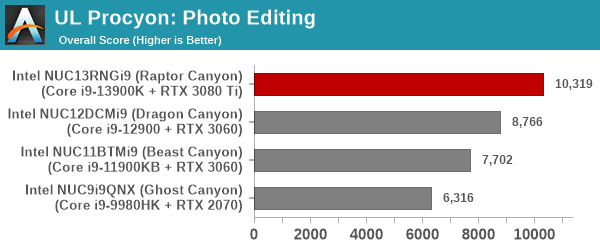
Moving on to the evaluation of Adobe Photoshop and Adobe Lightroom, we find Raptor Lake with a good lead over Dragon Canyon - a lot of which can be attributed to the higher TDP budget.
UL Procyon evaluates performance for video editing using Adobe Premier Pro.
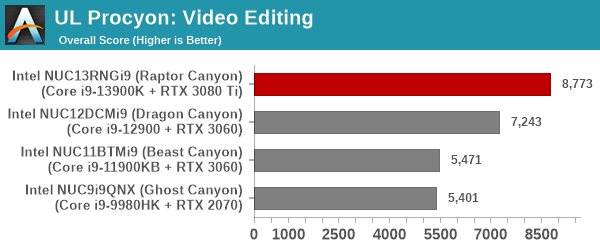
More of a GPU-centric workload, Premier Pro sees the Raptor Canyon emerge as the winner again - thanks to its ability to accommodate a very powerful discrete GPU.
BAPCo SYSmark 25
BAPCo's SYSmark 25 is an application-based benchmark that uses real-world applications to replay usage patterns of business users in the areas of productivity, creativity, and responsiveness. The 'Productivity Scenario' covers office-centric activities including word processing, spreadsheet usage, financial analysis, software development, application installation, file compression, and e-mail management. The 'Creativity Scenario' represents media-centric activities such as digital photo processing, AI and ML for face recognition in photos and videos for the purpose of content creation, etc. The 'Responsiveness Scenario' evaluates the ability of the system to react in a quick manner to user inputs in areas such as application and file launches, web browsing, and multi-tasking.
Scores are meant to be compared against a reference desktop (the SYSmark 25 calibration system, a Lenovo Thinkcenter M720q with a Core i5-8500T and 8GB of DDR4 memory to go with a 256GB M.2 NVMe SSD). The calibration system scores 1000 in each of the scenarios. A score of, say, 2000, would imply that the system under test is twice as fast as the reference system.
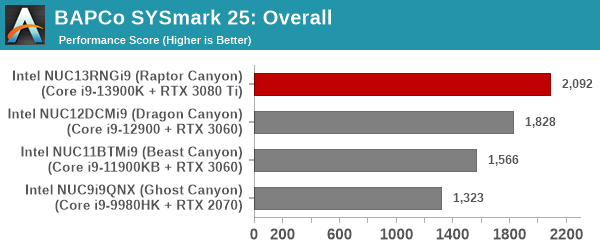
| BAPCo SYSmark 25 - Performance Scores | |||
SYSmark 25 also adds energy measurement to the mix. A high score in the SYSmark benchmarks might be nice to have, but potential customers also need to determine the balance between power consumption and the performance of the system. For example, in the average office scenario, it might not be worth purchasing a noisy and power-hungry PC just because it ends up with a 2000 score in the SYSmark 25 benchmarks. In order to provide a balanced perspective, SYSmark 25 also allows vendors and decision makers to track the energy consumption during each workload. In the graphs below, we find the total energy consumed by the PC under test for a single iteration of each SYSmark 25 workload. For reference, the calibration system consumes 8.88 Wh for productivity, 10.81 Wh for creativity, and 19.69 Wh overall.
| BAPCo SYSmark 25 - Energy Consumption | |||
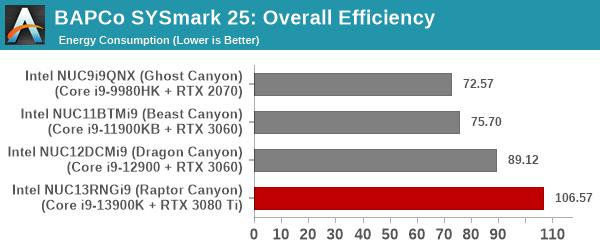
Raptor Canyon leads across the board in all workloads - it ends up more than twice as fast as the SYSmark 25 reference system. Unfortunately, there is no free lunch, and this comes at the cost of significant energy consumption as evidenced in the above graph.
BAPCo CrossMark 1.0.1.86
BAPCo's CrossMark aims to simplify benchmark processing while still delivering scores that roughly tally with SYSmark. The main advantage is the cross-platform nature of the tool - allowing it to be run on smartphones and tablets as well.
| BAPCo CrossMark 1.0.1.86 - Sub-Category Scores | |||
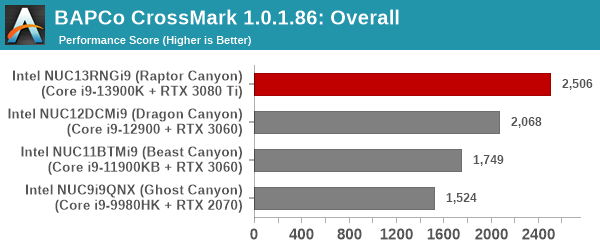
The relative performance seen in SYSmark 25 translate to CrossMark also, as expected. The responsiveness ratings vary significantly due to the usage of PCIe 4.0 NVMe SSDs in certain systems compared to PCIe 3.0 NVMe ones in others. Higher RAM speeds and the move to DDR5 are also partly responsible for the better scores.


27 Comments
View All Comments
DannyH246 - Friday, December 16, 2022 - link
Only if its Intel.TheinsanegamerN - Monday, December 19, 2022 - link
Nah the guy's house burnt down two years ago and there is LITERALLY nothing that anandtech could have done in 2 years to fix that.Bik - Tuesday, December 20, 2022 - link
I miss Ian gpu and Andrei mobile reviewsOxford Guy - Tuesday, December 20, 2022 - link
Size should fit the use case — aka diminished returns exist.DanaGoyette - Wednesday, December 21, 2022 - link
Does this happen to have ECC and vPro support? If so, that (combined with Thunderbolt 4) is already something most self-built machines can't do.missingno - Sunday, December 25, 2022 - link
Intel would burn down their own fabs before they ever put ECC support in their desktop boardshd-2 - Tuesday, January 3, 2023 - link
This thing has been absolutely awesome to play with...using a 7900 XT fits the TDP quite nicely and I'm getting 3x the performance of a computer that had 5x the volume (upgrading from first gen ThreadRipper/Titan build). I'm sure I'll be labelled an Intel shill for saying it, but after seeing a bunch of negative comments I figured I'd post a positive counter.