Zotac ZBOX MAGNUS EN1080 SFF PC Review: A Premium Gaming Powerhouse
by Ganesh T S on December 19, 2016 8:30 AM ESTPerformance Metrics - I
The Zotac ZBOX MAGNUS EN1080 was evaluated using our standard test suite for gaming mini-PCs. Not all benchmarks were processed on all the machines due to updates in our testing procedures. Therefore, the list of PCs in each graph might not be the same. In the first section, we will be looking at SYSmark 2014 SE, as well as some of the Futuremark benchmarks.
BAPCo SYSmark 2014 SE
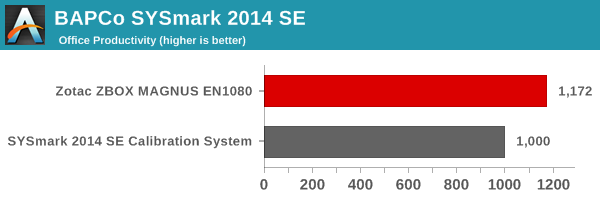
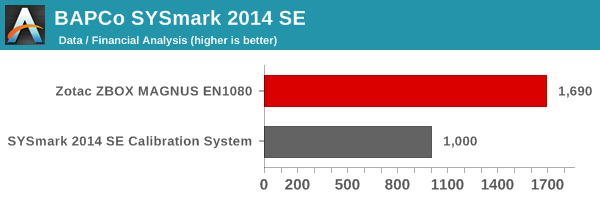
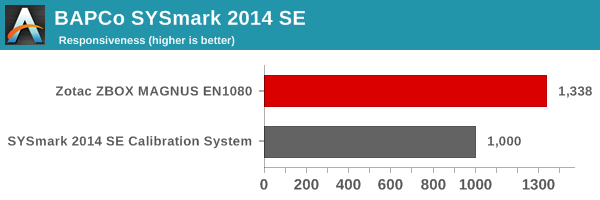
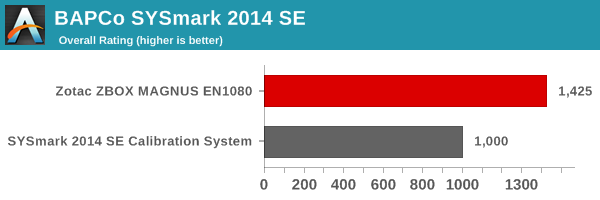
BAPCo's SYSmark 2014 SE is an application-based benchmark that uses real-world applications to replay usage patterns of business users in the areas of office productivity, media creation and data/financial analysis. In addition, it also addresses the responsiveness aspect - the user experience as related to application and file launches, multi-tasking etc. Scores are meant to be compared against a reference desktop (the SYSmark 2014 SE calibration system in the graphs below). While the SYSmark 2014 benchmark used a Haswell-based desktop configuration, the SYSmark 2014 SE makes the move to a Lenovo ThinkCenter M800 (Intel Core i3-6100, 4GB RAM and a 256GB SATA SSD). The calibration system scores 1000 in each of the scenarios. A score of, say, 2000, would imply that the system under test is twice as fast / better as the reference system.

SYSmark 2014 SE also adds energy measurement to the mix. A high score in the SYSmark benchmarks might be nice to have, but, potential customers also need to determine the balance between power consumption and the efficiency of the system. For example, in the average office scenario, it might not be worth purchasing a noisy and power-hungry PC just because it ends up with a 2000 score in the SYSmark 2014 SE benchmarks. In order to provide a balanced perspective, SYSmark 2014 SE also allows vendors and decision makers to track the energy consumption during each workload. In the graphs below, we find the total energy consumed by the PC under test for a single iteration of each SYSmark 2014 SE workload and how it compares against the calibration system.

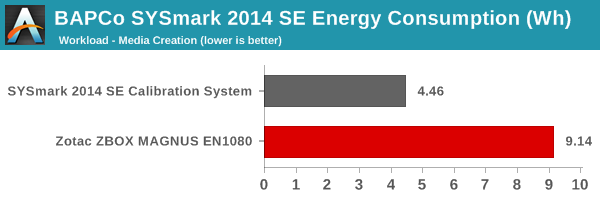
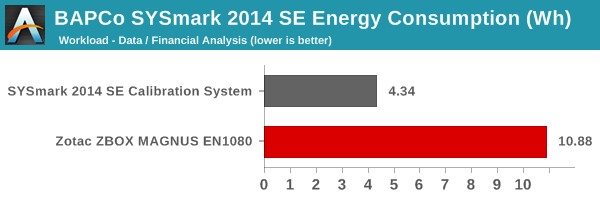
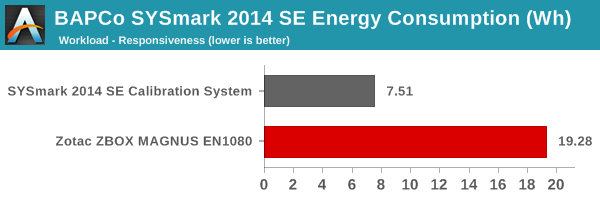
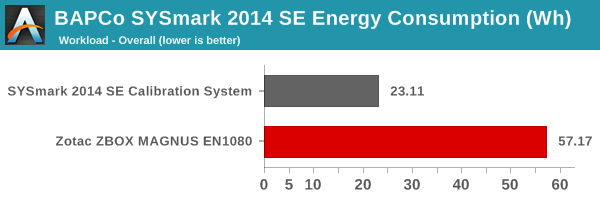
The Core i7-6700-based MAGNUS EN1080 obviously performs far better than the ThinkCenter M800 with a Core i3-6100. However, the presence of a discrete GPU in the EN1080 drives up the energy consumption quite a bit compared to the calibration system. The benchmark numbers just prove that the ZBOX MAGNUS EN1080 is no slouch when it comes to business tasks, but, it makes no sense to purchase it just for that purpose. Gaming is the obvious focus, and we will be looking at the relevant benchmarks starting with the next sub-section.
Futuremark PCMark 8
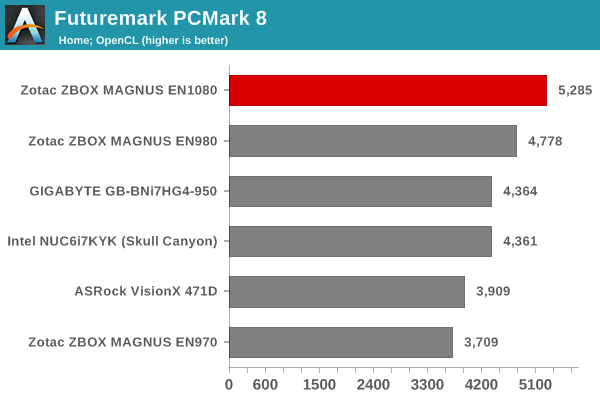
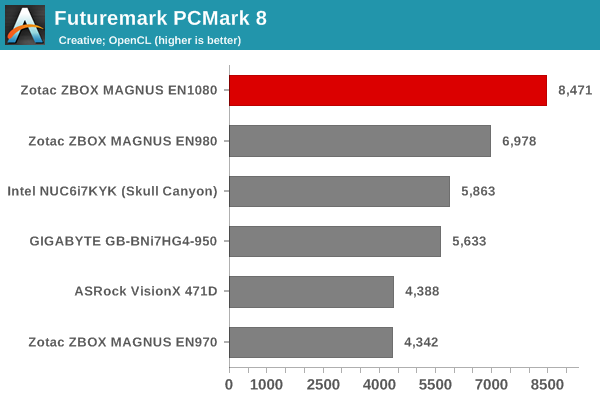
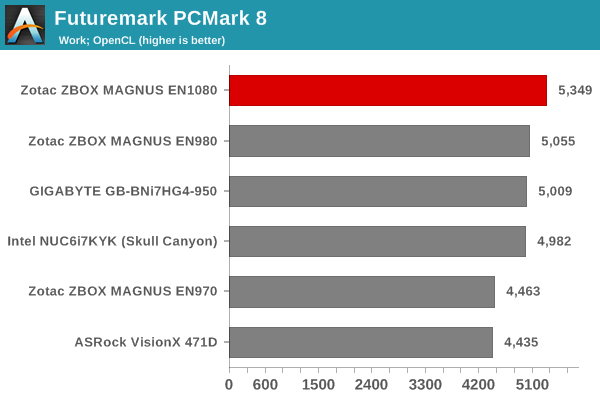
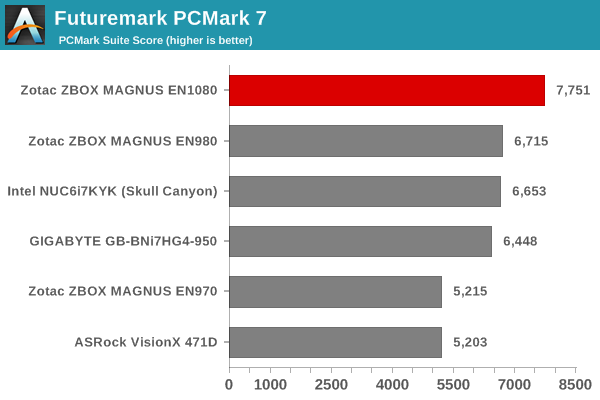
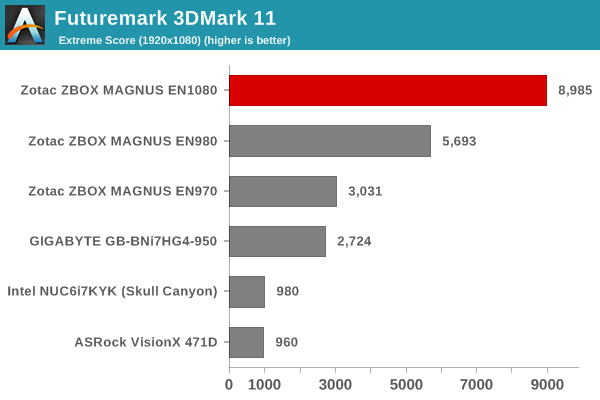
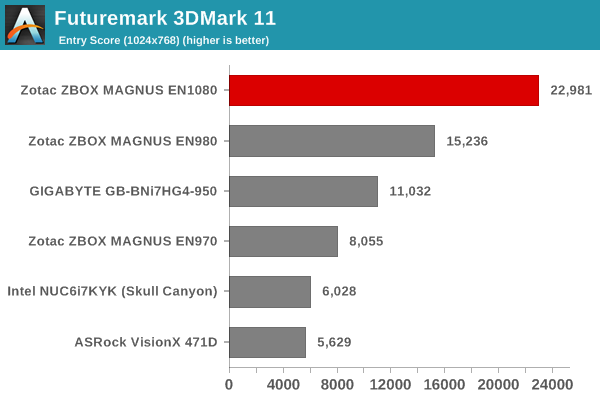
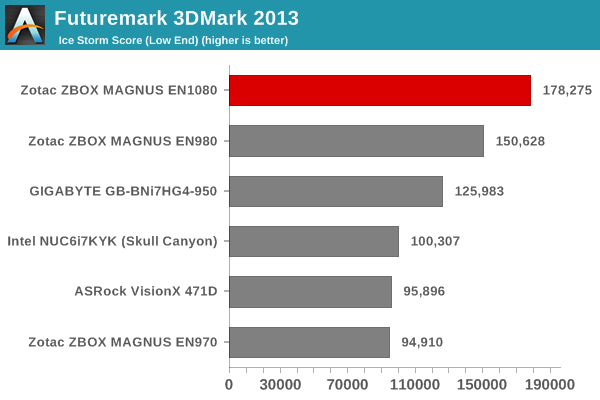
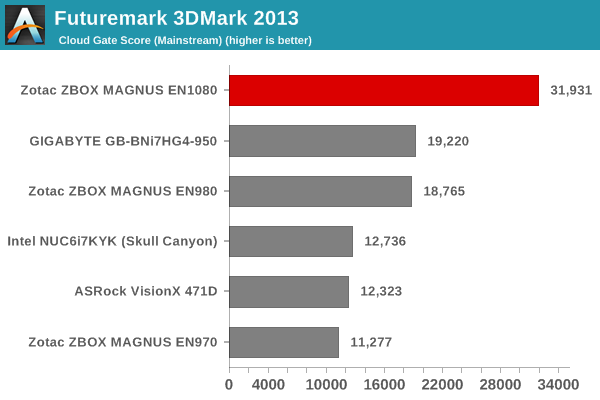
PCMark 8 provides various usage scenarios (home, creative and work) and offers ways to benchmark both baseline (CPU-only) as well as OpenCL accelerated (CPU + GPU) performance. We benchmarked select PCs for the OpenCL accelerated performance in all three usage scenarios. These scores are heavily influenced by the CPU in the system. The Core i7-6700 is the most powerful CPU that we have evaluated in the SFF PC space, and we have not seen any GPU as capable as the GTX 1080 in this market segment till now. Therefore, it is no surprise that the ZBOX MAGNUS EN1080 comes out on top in all of the Futuremark benchmarks.
Miscellaneous Futuremark Benchmarks
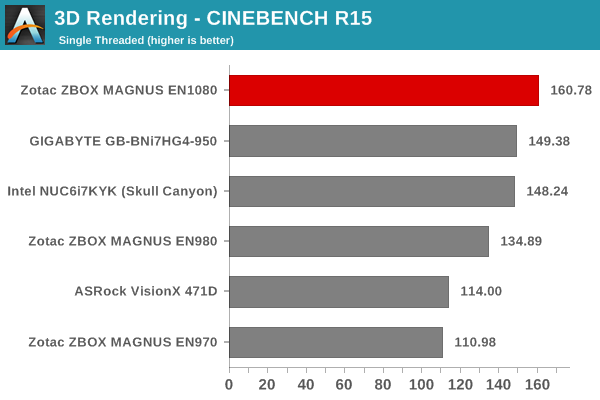
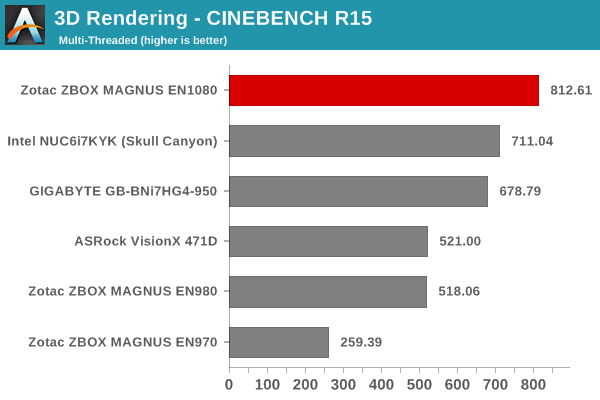
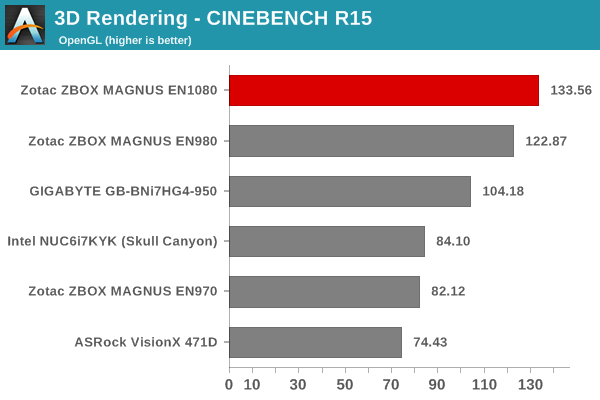
3D Rendering - CINEBENCH R15
We have moved on from R11.5 to R15 for 3D rendering evaluation. CINEBENCH R15 provides three benchmark modes - OpenGL, single threaded and multi-threaded. Evaluation of select PCs in all three modes provided us the following results. As we saw in the Futuremark benchmarks, the ZBOX MAGNUS EN1080 easily comes out on top in all of the modes.


38 Comments
View All Comments
Michael Bay - Monday, December 19, 2016 - link
There was a nice trend of posting size comparison pics with a can of soda and a cig pack.I really wish it came back.
BrokenCrayons - Monday, December 19, 2016 - link
I want to oogle Ganesh's cans via review photos. :DOooh! Maybe we should start a GoFundMe to soak up the cost of purchasing a can so there's no out-of-pocket expense. If we pull it off, it might be possible for the readers to get a look at everyone's cans.
cm2187 - Tuesday, December 20, 2016 - link
Unfortunately a can of coke is not an international measure:https://en.wikipedia.org/wiki/Beverage_can#Standar...
Renagade - Wednesday, December 21, 2016 - link
how bout a tape measure, ruler, yard stick - something - perhaps with both metric and american markings? This way - EVERYONE wins and the international measure standards are coveredK_Space - Monday, December 19, 2016 - link
I think those belonged to either Ian or Brandon (the cola can I think).... No one else got em!¬_¬
cknobman - Monday, December 19, 2016 - link
Cool system but IMO since a GTX 1080 is not quite enough for full blown 4k gaming then why waste all that money getting it.The best buy is the ZOTAC ZBOX MAGNUS EN1070 Gaming Mini PC, Intel Skylake Core i5-6400T which only costs $1200.
GTX 1070 is powerful enough to handle anything 2k and below which is all you could really do comfortably with the 1080 version so most of that extra $800 would be going to waste.
https://www.amazon.com/dp/B01M3062Z5/ref=psdc_1389...
TheinsanegamerN - Monday, December 19, 2016 - link
It isnt enough for 4k, but it is enough for 1440p, or for 1080p for years from now. You could buy this with the knowledge that, at 1080p, say with a g sync monitor, you would not need to replace it for 5+ years.also, the 1070 is not enough to consistently max out 1440p, or do 1400p or 1080p consistent at 144 hz refresh rates. the 1080 isnt quite enough either, but its a heck of a lot closer.
cknobman - Monday, December 19, 2016 - link
LOL no card can max out 1440 @144hz consistently (you even put it in your own post) so why waste $800 getting a 1080 when a 1070 is enough to get 60+fps in 1440 everywhere and will do any game @1080p (even lesser cards than that are more than enough for 1080)?Again IMO save $800 and get the 1070 config.
zenonu - Monday, December 19, 2016 - link
My Titan X (P) hits 1440p 144Hz in a significant amount of games. The 1080 doesn't need to hit 1440p 144Hz consistently either to provide a significant amount of value from between 60Hz and 144Hz. There is a place for this product, and your own financial valuation of this product is generally only relevant to you.LordanSS - Monday, December 19, 2016 - link
1080p60 with SuperSampling. There.