The Silicon Motion SM2262EN SSD Controller Preview: Good And Bad Amplified
by Billy Tallis on August 1, 2018 11:45 AM EST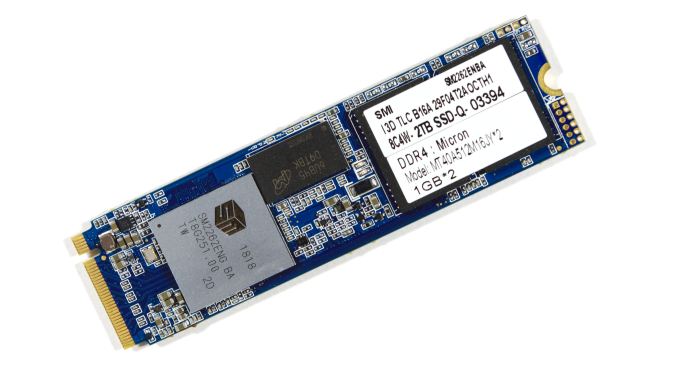
Silicon Motion's second-generation NVMe SSD controllers have all but taken over the consumer NVMe SSD market. Drives like the HP EX920 and ADATA SX8200 currently offer great performance at prices that are far lower than what Samsung and Western Digital are charging for their flagship products. These Silicon Motion-based SSDs are using the SM2262 controller - the high-end member of SMI's current lineup - but they're almost as cheap as the entry-level NVMe drives that use low-end controllers with limited performance. Phison's second-generation high-end E12 controller still hasn't hit the shelves, so Silicon Motion has no serious competition for the SM2262.
But Silicon Motion isn't standing still. They've prepared an update to the SM2262 controller called the SM2262EN. This was first previewed at the same time that the SM2262 was announced, but Silicon Motion didn't provide much guidance on the timing. The SM2262 controller hit the market with the Intel SSD 760p in January, and the SM2262EN is almost ready for release. With the SM2262EN, Silicon Motion is promising substantial performance improvements that go well beyond what we usually see from firmware optimizations, though the hardware changes relative to the SM2262 are minimal. The updated controller should hit the market in time to compete against Phison E12 SSDs and the first wave of drives with 96-layer 3D NAND.
| Silicon Motion NVMe SSD Controller Comparison | |||||
| Controller | SM2262EN | SM2262 | SM2263 | SM2263XT | SM2260 |
| Host Interface | PCIe 3.0 x4 | ||||
| Protocol | NVMe 1.3 | NVMe 1.2 | |||
| NAND Flash Channels | 8 | 8 | 4 | 4 | 8 |
| NAND Chip Enable lines | 4 | 4 | 4 | 4 | 4 |
| NAND interface speed | 800 MT/s | 667 MT/s | 533 MT/s | ||
| Typical NAND | IMFT 64L 3D TLC | IMFT 32L 3D MLC/TLC | |||
| DRAM Support | DDR3(L), LPDDR3, DDR4 |
No (HMB* supported) |
DDR3(L), LPDDR2 |
||
| DRAM Bus Width | 32/16-bit | 16-bit | N/A | 32/16-bit | |
| Controller Package | 18x16mm 472-ball TFBGA |
12x12mm 288-ball TFBGA |
18x16mm 472-ball TFBGA |
||
| Sequential Read MB/s | 3500 | 3200 | 2400 | 2400 | 2400 |
| Sequential Write MB/s | 3000 | 1900 | 1700 | 1700 | 1000 |
| Random Read IOPS | 420k | 370k | 300k | 280k (HMB*) 120k (no HMB*) |
120k |
| Random Write IOPS | 420k | 300k | 250k | 250k | 140k |
| *HMB = Host Memory Buffer - where an SSD uses system DRAM to save cost by not having any of its own | |||||
To assess the new SM2262EN controller solution, Silicon Motion has provided us with a 2TB reference design SSD with their latest firmware, a work in progress as Silicon Motion continues to optimize performance. This is a higher capacity drive than any of the SM2262 SSDs we've tested, and some performance improvement may be due simply to the capacity increase. However, even at 1TB we already have several NAND dies on each of the controller's 8 channels, so adding more dies shouldn't have a huge impact, especially not for sequential transfers.
| SM2262EN Engineering Sample Specifications | |
| Usable Capacity | 2000 GB |
| Controller | Silicon Motion SM2262EN |
| Firmware Version | SVN112 |
| NAND Flash | Intel 64-layer 256Gb 3D TLC |
| Form-Factor | double-sided M.2 2280 |
| Interface | PCIe 3 x4 |
| DRAM | 2GB Micron DDR4-2400 CL16 |
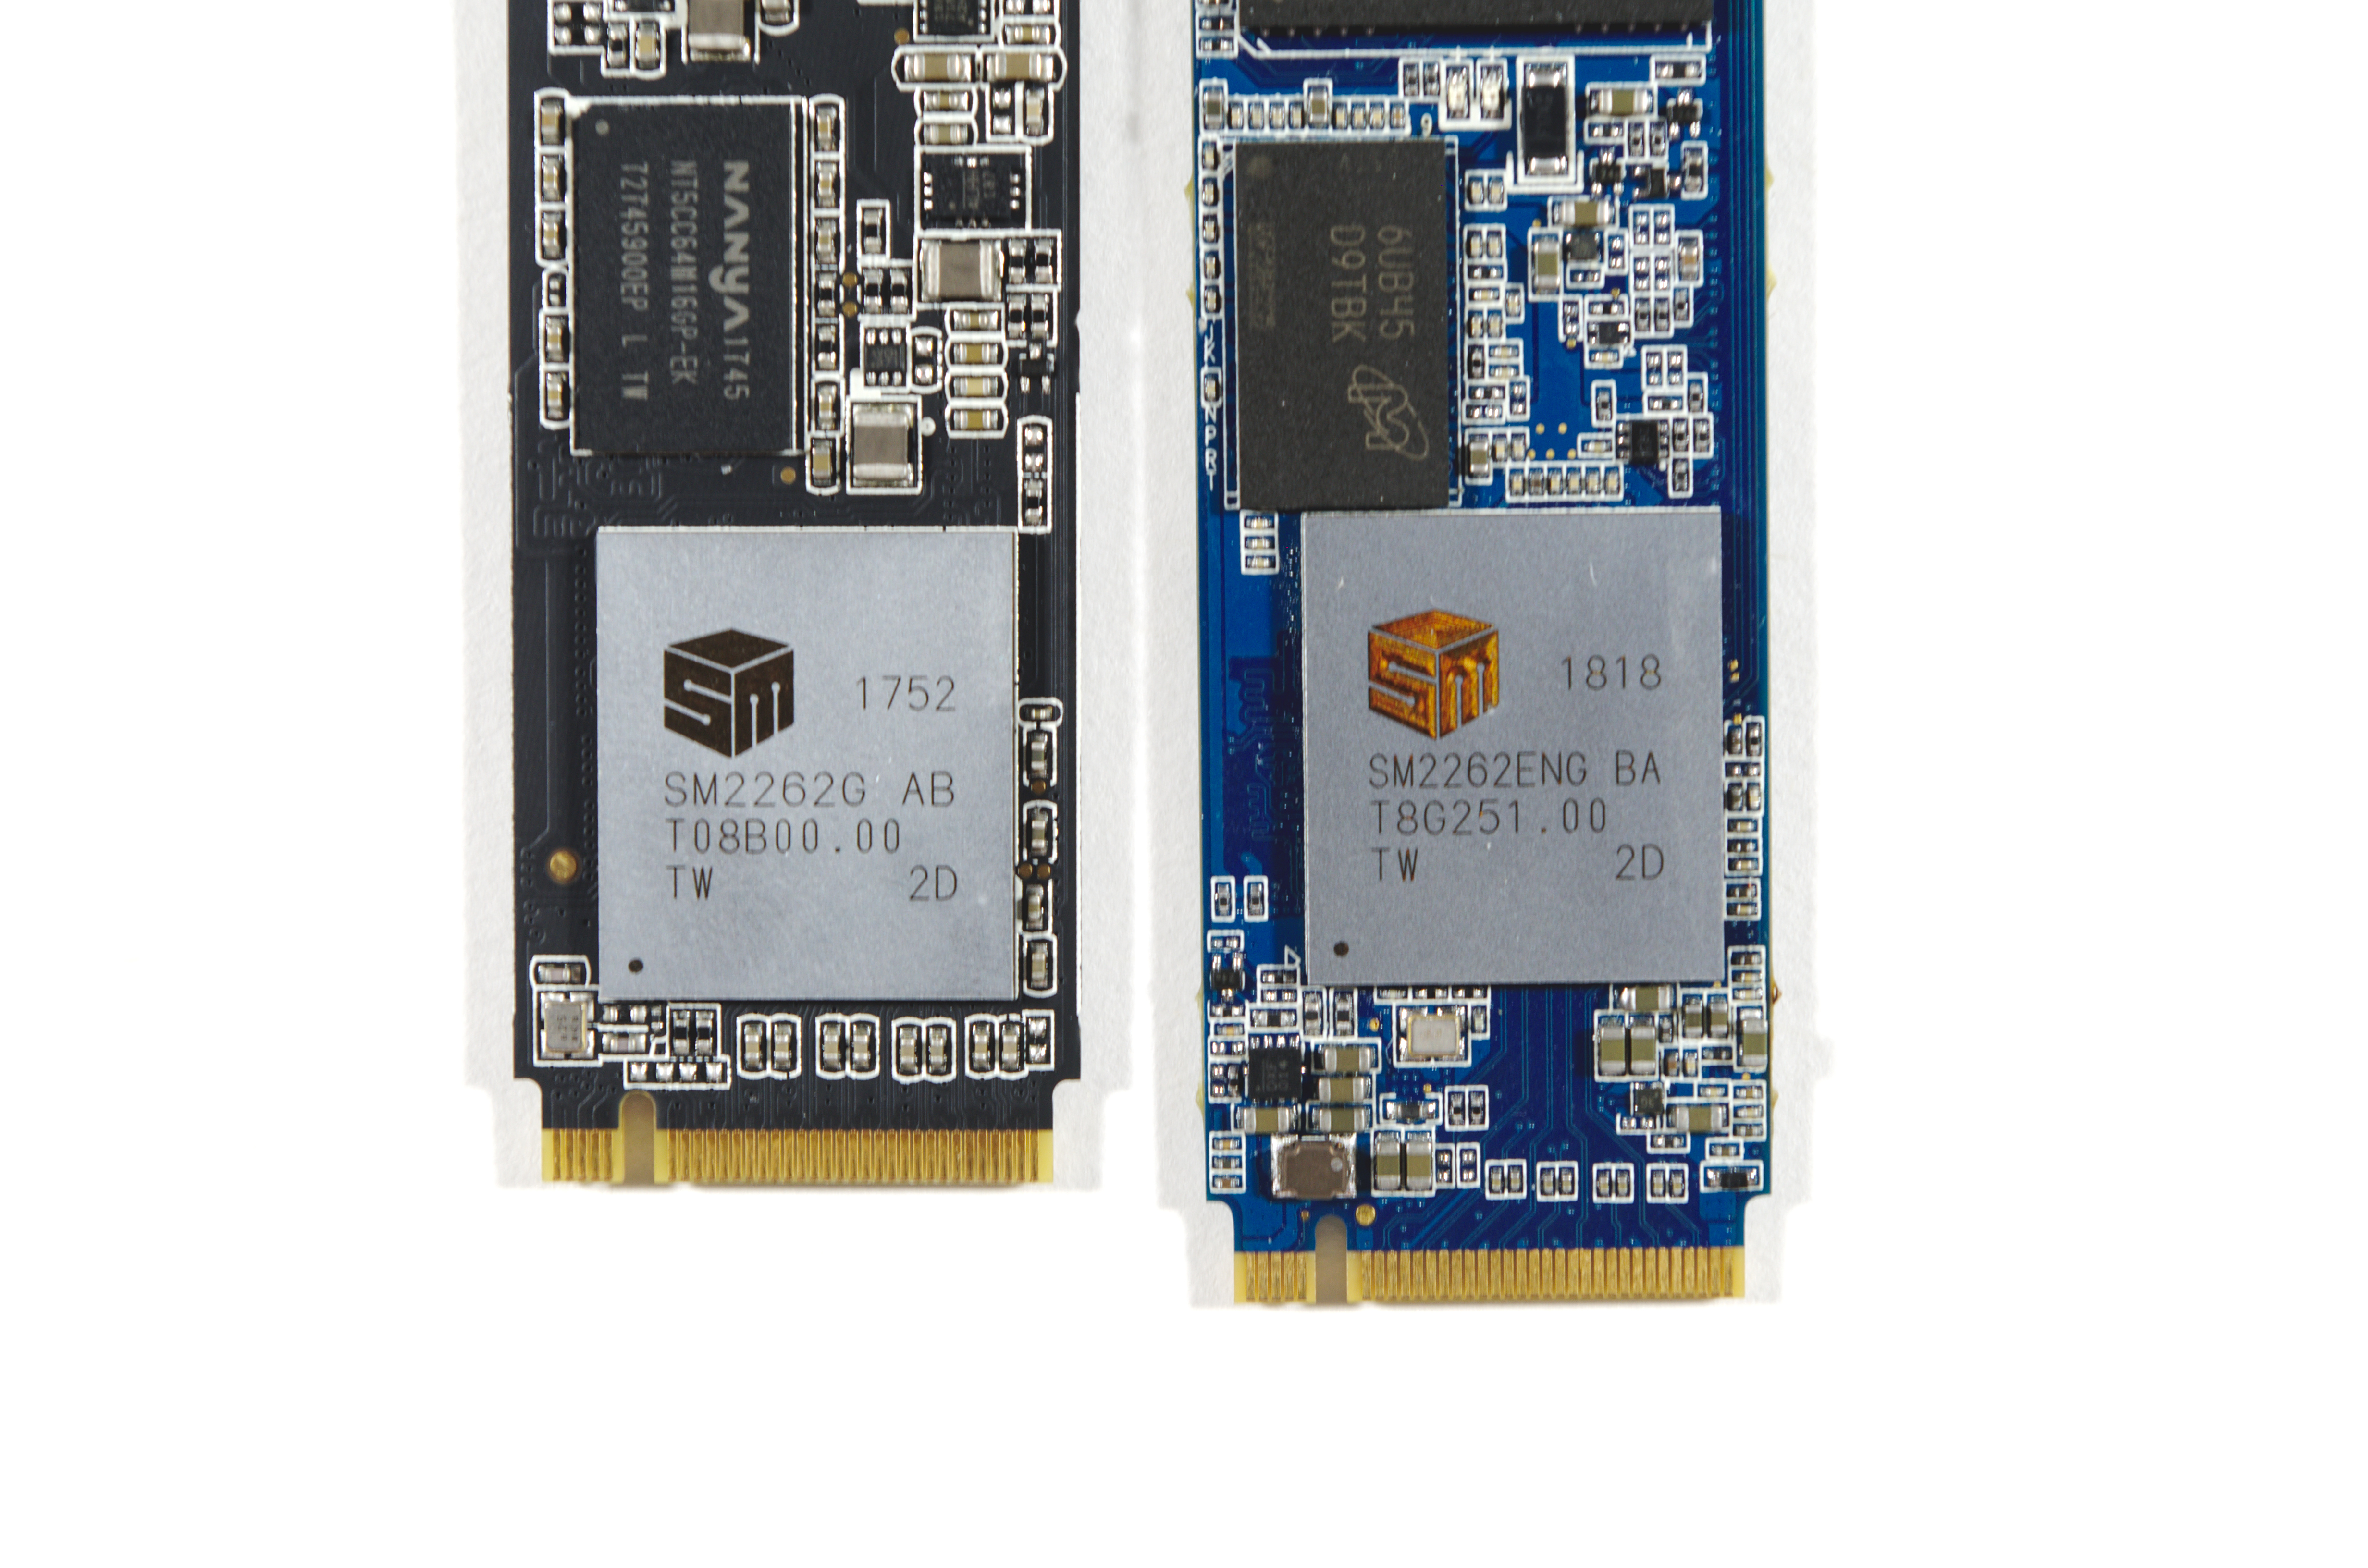
SM2262 (left) and SM2262EN (right)
This 2TB configuration represents the maximum practical capacity when using 256Gb NAND dies, as it requires four packages with stacks of sixteen dies. The usable capacity is configured as about 2000 GB. The PCB layout is generally the same as for the SM2262 drives we've seen, with one DRAM package and two NAND packages on each side. This drive uses 2GB of Micron DDR4 DRAM, while all of the SM2262 retail drives we've seen use DDR3L.
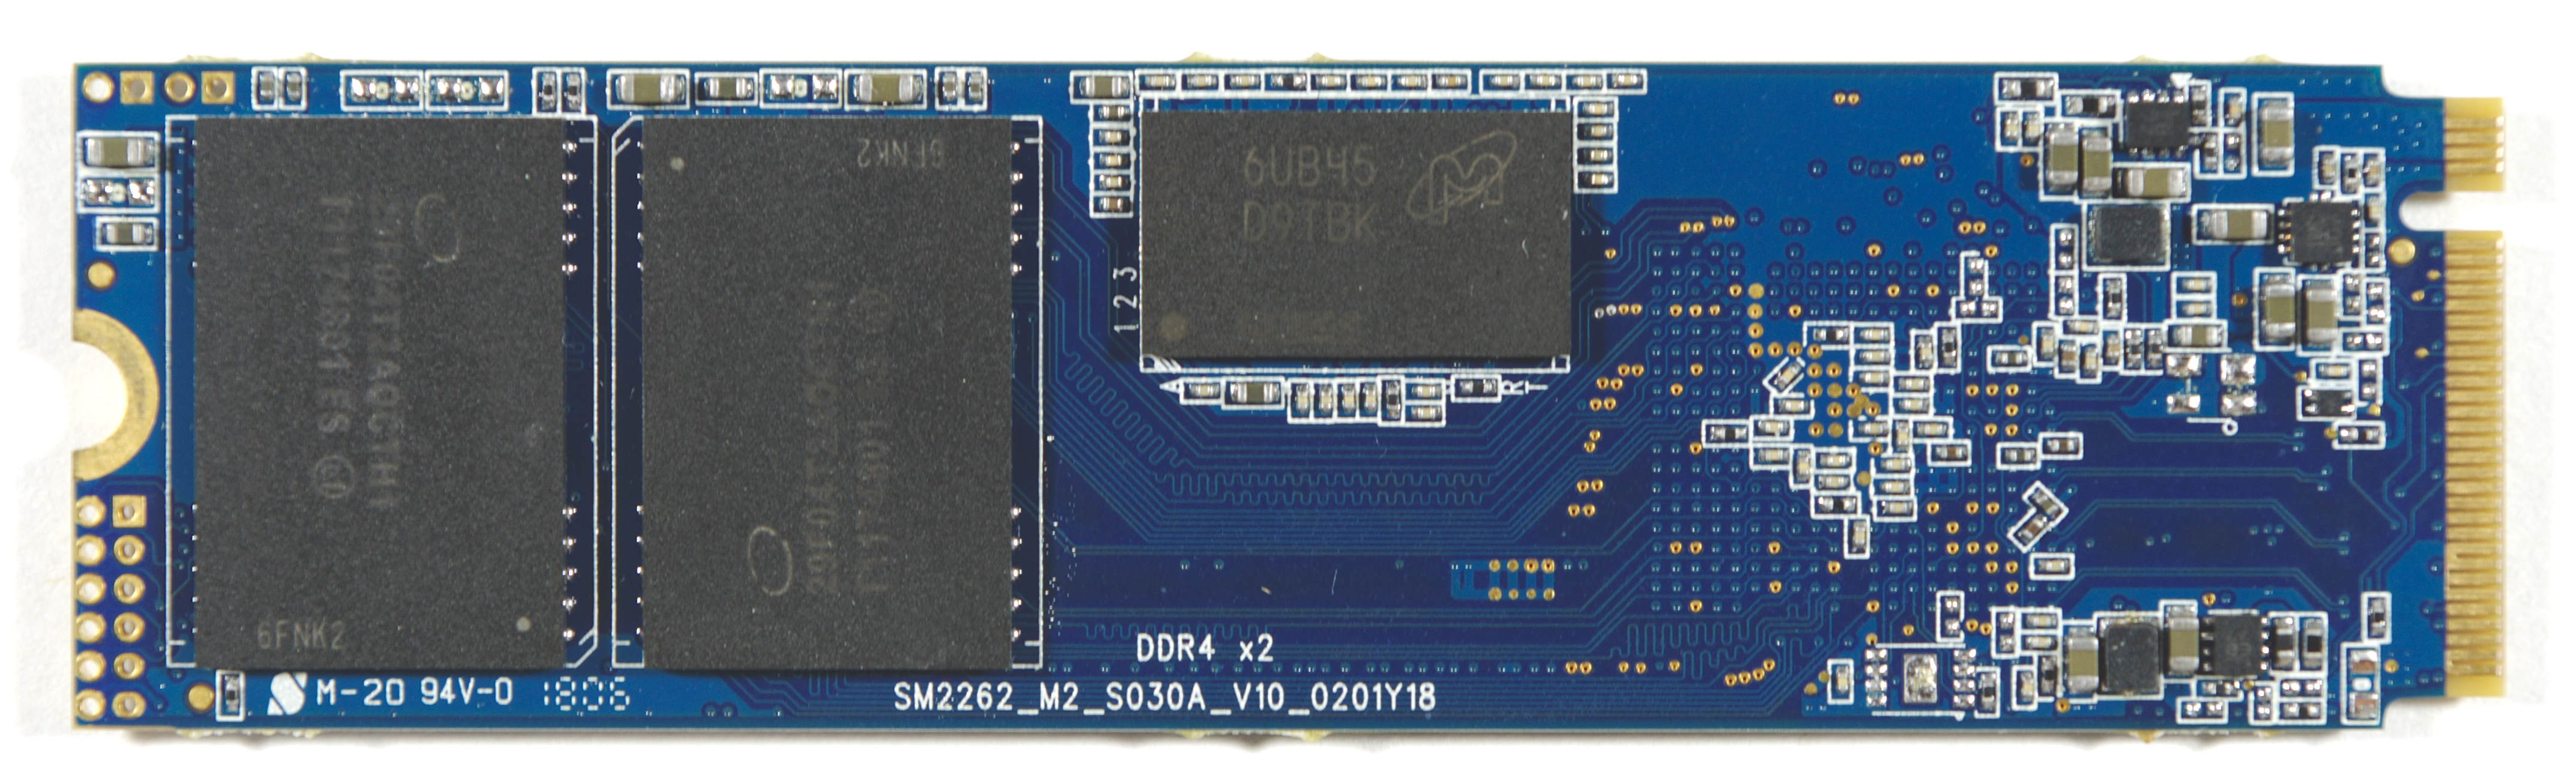
The switch to DDR4 gives a slight improvement to voltage and latency, and a big boost to throughput—which is probably necessary to make the most of the EN controller variant. The use of DDR4 does add slightly to the cost of the drive, but not enough to prevent this change from carrying over into retail products. The DRAM update still leaves Silicon Motion a bit behind Samsung, which has moved its SSDs to LPDDR4 and reaped significant power savings.
For this review, the 2TB SM2262EN drive is compared against other recent NVMe SSDs, primarily high-end drives. The results from our engineering sample of the upcoming Phison E12 controller are also included, and these two new controller solutions will probably be responsible for the stiffest competition in the NVMe SSD market segment once they are both shipping in volume.
| AnandTech 2018 Consumer SSD Testbed | |
| CPU | Intel Xeon E3 1240 v5 |
| Motherboard | ASRock Fatal1ty E3V5 Performance Gaming/OC |
| Chipset | Intel C232 |
| Memory | 4x 8GB G.SKILL Ripjaws DDR4-2400 CL15 |
| Graphics | AMD Radeon HD 5450, 1920x1200@60Hz |
| Software | Windows 10 x64, version 1709 |
| Linux kernel version 4.14, fio version 3.6 | |
| Spectre/Meltdown microcode and OS patches current as of May 2018 | |
- Thanks to Intel for the Xeon E3 1240 v5 CPU
- Thanks to ASRock for the E3V5 Performance Gaming/OC
- Thanks to G.SKILL for the Ripjaws DDR4-2400 RAM
- Thanks to Corsair for the RM750 power supply, Carbide 200R case, and Hydro H60 CPU cooler
- Thanks to Quarch for the XLC Programmable Power Module and accessories
- Thanks to StarTech for providing a RK2236BKF 22U rack cabinet.


28 Comments
View All Comments
DigitalFreak - Wednesday, August 1, 2018 - link
One thing has always confused me about these benchmarks. Does performance get progressively worse as the drive fills up? For example, the ATSB - Light average latency for the drive is 48 mu empty and 330 mu full. Does that mean when the drive is 50% full the latency would be around 189 mu? Or does it run at 48 mu until the drive hits 100% full? Same for the average data rate.Billy Tallis - Wednesday, August 1, 2018 - link
I think there's usually a threshold at which performance drops pretty rapidly because the SLC cache or spare area is no longer large enough. Unfortunately, determining the shape of the curve and where the threshold is (if there is one) is extremely time-consuming, and the tools used for the ATSB tests don't make it easy to test multiple drives in parallel.I did run the Heavy and Light tests on this drive with it 80% full and the results were similar to the 100% full case. But manual overprovisioning like that doesn't necessarily have the same impact that re-tuning the firmware would. A typical variable-size SLC cache won't be significantly larger for an 80% full drive than for a 100% full drive.
And there's still the problem that the ATSB tests don't give the drive any long idle periods to flush the SLC cache. The SLC cache on a full drive might be large enough to handle the Heavy test reasonably well if it gets a realistic amount of idle time to flush the cache mid-test. But that would take the Heavy test from 1.5 hours to a full day.
DigitalFreak - Wednesday, August 1, 2018 - link
Understandable. With the huge performance difference between empty and full with this controller, I was just curious at what percentage used the drive performance tanked. Based on your test we already know that 80% full is just as bad as 100%. Hopefully it's not any lower than that.justaviking - Wednesday, August 1, 2018 - link
I had the exact same question. How full is full?If the performance hit did not occur until 95% full or more, then it would be easily avoidable and acceptable (to me). If it happens at 30% full, it's a deal breaker. Or a linear degredation would also unacceptable to me since the degredation is so extreme.
I STRONGLY ENCOURAGE taking the time to explore the "degradation curve" relative to "fullness" for this drive, since it is so dramatic. It could make a special article of the type AnandTech excels at.
29a - Wednesday, August 1, 2018 - link
I agree.jtd871 - Wednesday, August 1, 2018 - link
How long of a "long idle time" do you need? Are you talking about 1.5h run time for ATSB to 8h or 24h with sufficiently long "long idle times"?Billy Tallis - Wednesday, August 1, 2018 - link
Currently, the ATSB tests cut all idle times down to a maximum of 25ms. I suspect that idle times on the order of seconds would be sufficient, but I don't think we even still have the original traces with the full idle times. In the near future I'll do some SYSmark runs with a mostly-full drive; that's a similar intensity of storage workload to the ATSB light, but with a fairly realistic pacing including idle.I'll also try to compare the power data against the performance test duration for the synthetic tests. That should reveal how long the drive took to return to idle after the writing stopped, and give us a pretty good idea of how quickly the drive can empty the SLC cache and how high of a duty cycle it can sustain for writes at full speed.
Dark_wizzie - Wednesday, August 1, 2018 - link
A larger drive helps mitigate the issues because 1) Larger drives tend to have large SLC cache? Or 2) There is more normal free space for the drive?Billy Tallis - Wednesday, August 1, 2018 - link
Both, in a big way when it's 2TB, and especially when you have a variable-size SLC cache. A mostly-empty 2TB drive can have over 100GB of SLC cache, which is absolutely impossible to fill up with any real-world client workload.mattrparks - Wednesday, August 1, 2018 - link
I wonder if...I think you could get similar results (stellar performance characteristics at low drive usage) by using a larger DRAM read/write cache when the drive mapping table is not taking up as much RAM. With 2GB of DDR4, let's say arbitrarily that 1.5GB of that is used by FTL page mapping tables when the drive is full. What if you found a way in firmware to manage your memory such that when most of the drive FTL is unmapped, that you could use say only 0.5GB for the mapping table and have an extra 1GB available for caching? Many of the synthetic tests could be gamed by keeping that much drive cache. I don't remember your drive testing methodology fully, but perhaps a full power cycle of the drive after the data is written, before the read tests, would make sure that all the performance is indeed SLC speed and not just enormous amounts of caching.